6.5 Fronts
6.5 Fronts
During World War I, Vilhelm Bjerknes, a Norwegian physicist with expertise in radio science and fluid mechanics, was asked to form a Geophysical Institute in Bergen, Norway. Cut-off from weather data due to the war, he arranged for a dense network of 60 surface weather stations to be installed. Some of his students were C.-G. Rossby, H. Solberg, T. Bergeron, V. W. Ekman, H. U. Sverdrup, and his son Jacob Bjerknes.
Jacob Bjerknes used the weather station data to identify and classify cold, warm, and occluded fronts. He published his results in 1919, at age 22. The term “front” supposedly came by analogy to the battlefronts during the war. He and Solberg later explained the life cycle of cyclones. Their description is known as the Norwegian cyclone model.
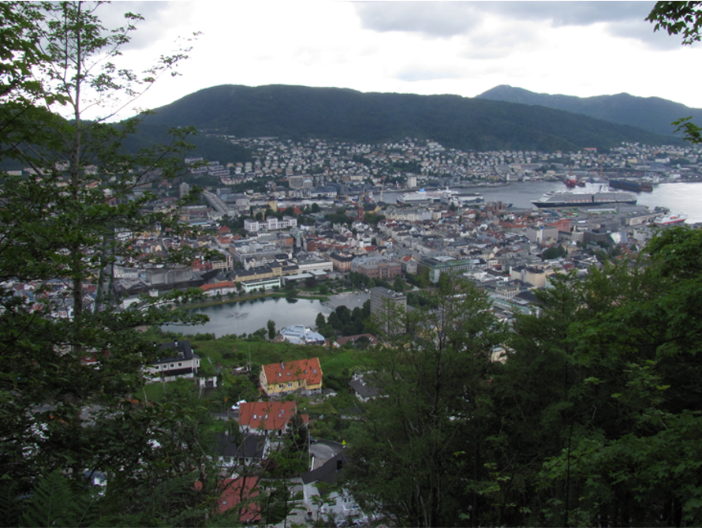
The Bergen School of Meteorology still exists today, although it no longer has the notoriety of the 1900s. This photo is of Bergen, Norway. The school is spread throughout the city, so this picture depicts the current university too.
The remainder of this module and the next module on midlatitude cyclones examines the concepts in the Norwegian cyclone model. This conceptual model was developed as weather balloon data became available, and researchers could analyze the vertical structure of the atmosphere. Prior to weather balloon data, only surface observations were available. Thus, the Norwegian cyclone model fits both of these data sets into our understanding of the atmosphere.
6.5.1 What Happens when Air Masses Collide?
In an effort to balance the differential heating across the planet, the tropical (T and E) air masses move north and the polar (P and A) air masses move south. These air masses collide and the transition zone between different air masses is called a front.
Since air masses have different temperature and humidity characteristics, a front signifies a change in:
- Temperature
- Dew point or humidity
- Wind direction
- Surface pressure
- Clouds and precipitation
Remember frontal lift is a mechanism for adiabatic cooling, clouds, and sometimes precipitation. As air masses collide, the denser or colder one ends up on the bottom and the lighter or warmer one is lifted. The most important fronts in the Norwegian cyclone model are cold fronts, warm fronts, stationary fronts, and occluded fronts. Three other boundaries which appear on surface analysis weather maps in the United States are dry lines, squall lines, and troughs. We will examine all of these fronts and boundaries.
Over time the air masses modify and mix, but not during their initial interactions.
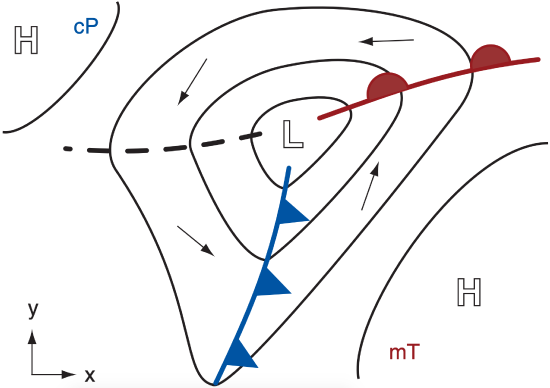
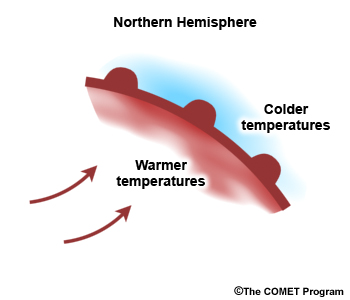
Fronts are typically associated with a low-pressure center and are rarely isolated from each other. A typical configuration in the Northern Hemisphere has a counterclockwise rotation around the low-pressure center. The fronts connect to each other at this low-pressure center where the highest precipitation amounts usually occur. The next diagram illustrates a classic cold front (blue) and warm front (red) configuration. Notice the high pressure associated with the cP and mT air masses.
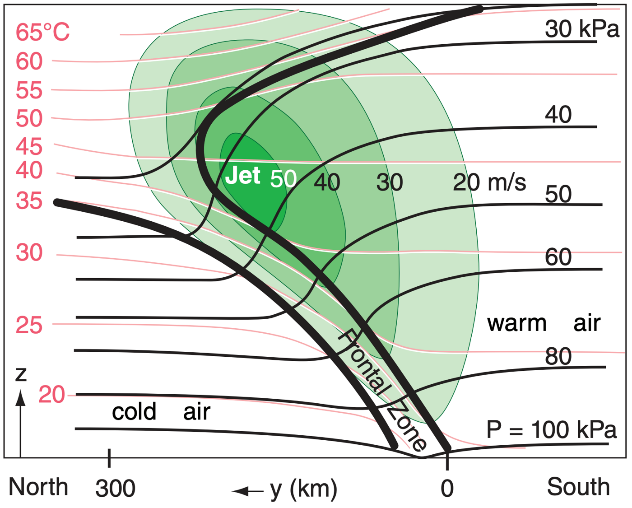
Taking a cross-section through the cold front (blue) yields a diagram like below. The strongest winds (jet) are aloft over the cold front. This particular jet would then connect into the hemispheric jet stream pattern. Hence, jet streams, Rossby waves, and fronts are all interconnected in a storm system. Fronts are more surface-based phenomena. Rossby waves and jet streams are aloft. The movement of air masses creates all of these phenomena at different levels in the atmosphere.
6.5.2 Cold Front
The leading edge of a cold air mass is called a cold front.
The symbol for a cold front is a blue line with triangles on one side. The triangles point in the direction the front is moving.
In the Northern Hemisphere, cold, drier air (cP) is frequently behind the cold front. Surface pressures are lowest at the front.
Winds switch from a southerly direction ahead of the cold front to a northerly direction behind it. The movement of a cold front on average is 20 to 25 mph. The exact speed is determined by the wind speed behind the front.
Clouds behind the cold front can change to scattered cumulus or stratocumulus or be completely clear. The cold air behind the front is relatively dry and stable. Precipitation primarily occurs with the front.
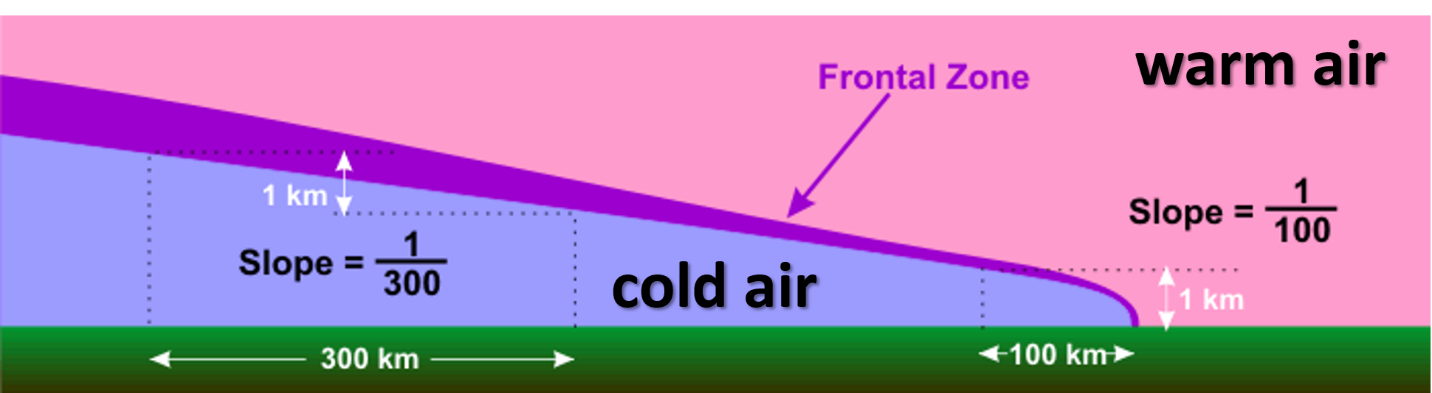
A cold front frequently has an abrupt vertical boundary which can cause cumulonimbus to develop near the front. These thunderstorms may be associated with heavier precipitation. Notice on this figure that the slope of the leading edge of the front is much higher than further behind it. Clouds behind the cold front can change to scattered cumulus or stratocumulus or be completely clear. The cold air behind the front is relatively dry and stable. Precipitation primarily occurs with the front.
6.5.3 Warm Front
The leading edge of a warm air mass is called a warm front.
The symbol for a warm front is a red line with half circles. The half circles are on the side of the line towards which the warm air is moving.
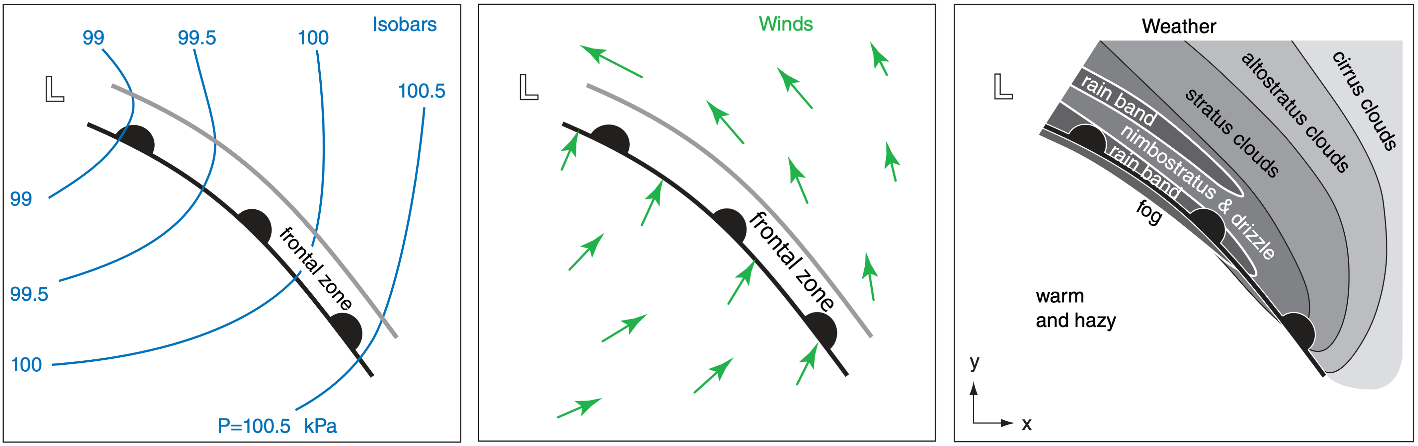
In the Northern Hemisphere, warm, moist air (mT) is frequently behind the warm front. Surface pressures have a relative minimum at the front. The change in pressure is much less than what is observed with a cold front.
Winds ahead of a warm front have an easterly component and behind the front more of a southerly component. These southerly winds advect in warm, humid air. The movement of a warm front is much slower than a colder front and is about 10 to 15 mph. This speed is determined by the winds behind the warm front and the winds in the cooler air ahead of the front. Since the cooler air is denser, the warm front will override this cooler air rather than move it out of the way.
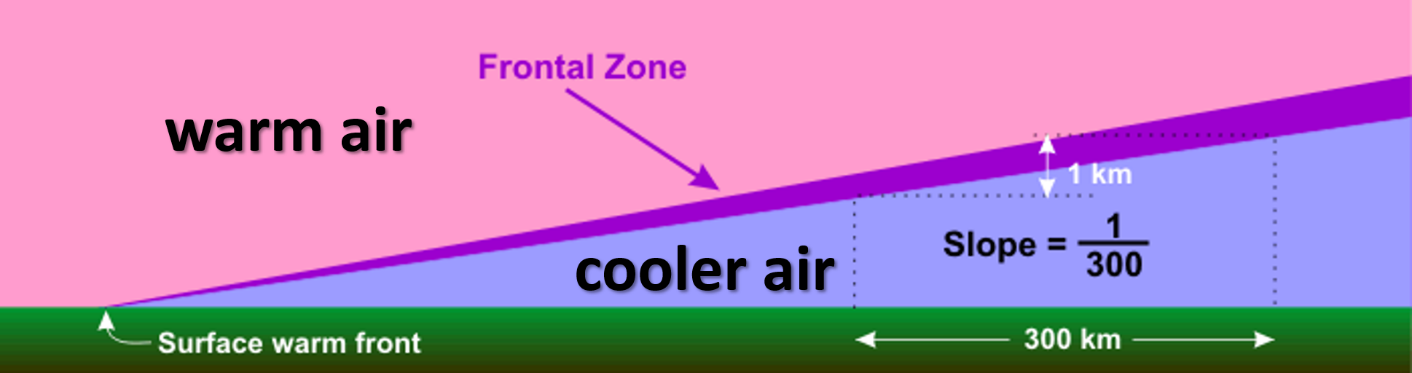
The warm air mass rises slowly over a cooler air mass. An abrupt vertical boundary is not present, so no cumulonimbus or thunderstorms are present. Precipitation is in the form of a uniform rain from a strato-form type of cloud ahead of the front.
The gradual rising of the warm air can cause a variety of clouds near or ahead of the warm front. For example, fog, nimbostratus, stratus, altostratus, and cirrus are illustrated in this figure. All the clouds and precipitation occur ahead of a warm front, which is much different than a cold front.
6.5.4 Stationary Front
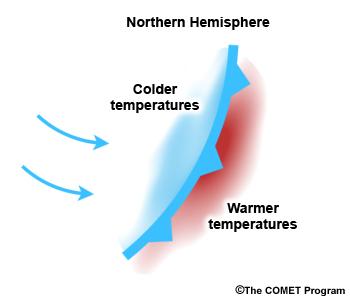
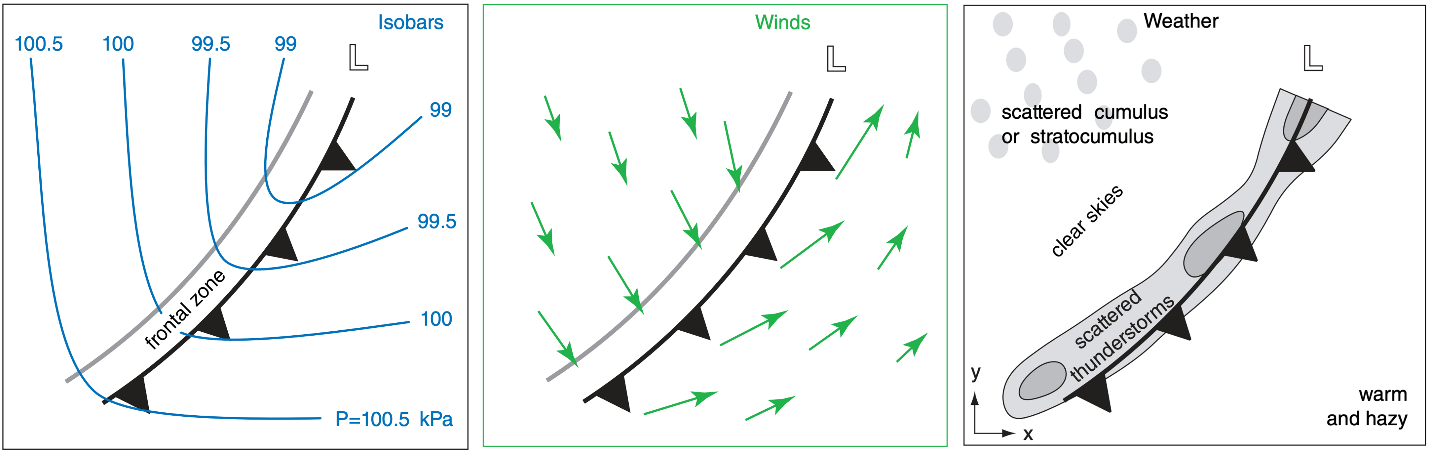
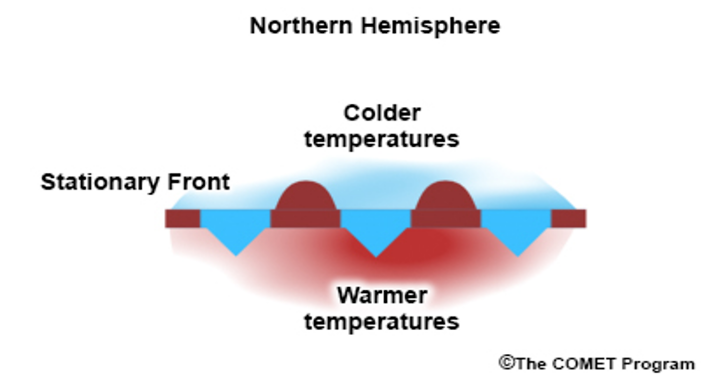
A stationary front is a front that is not moving or is moving less than 5 mph. One side of a stationary front has cooler air and the other side warmer air. The stationary front symbol has alternating cold front and warm front symbols. Surface winds are frequently parallel to a stationary front when the two air masses initially meet.
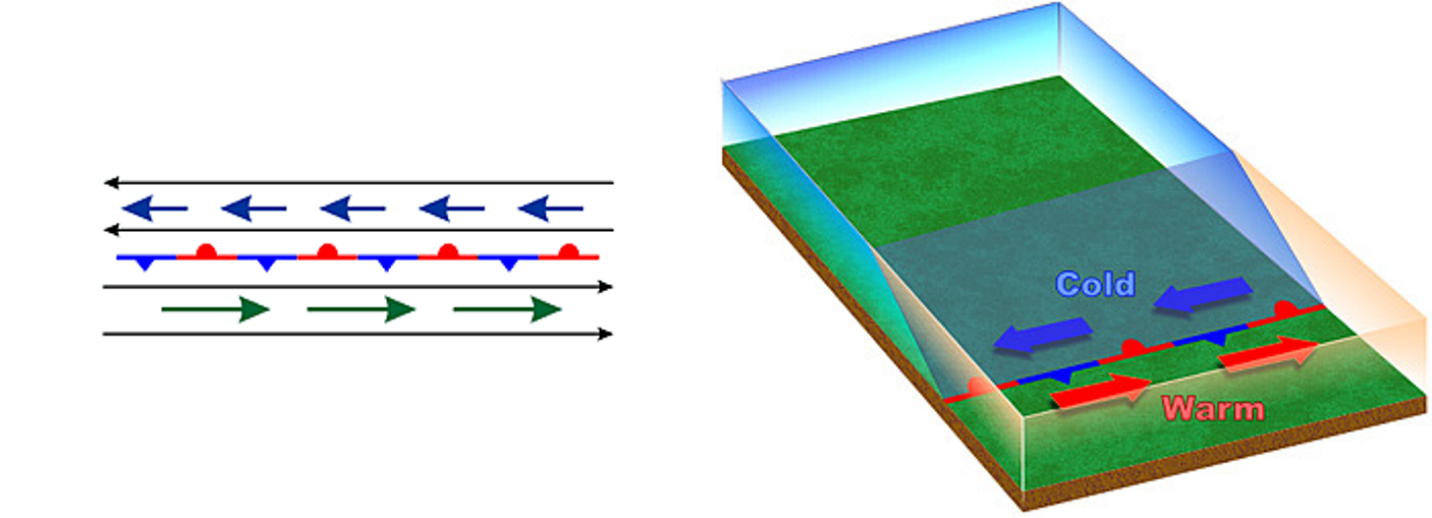
This next diagram gives a broader view of two air masses meeting, the winds associated with each air mass, and the stationary front between them. By default, stationary fronts form in regions of lower pressure which is true for all fronts.
Clouds associated with a stationary front depend on how much lift the warm air experiences as it flows over the cooler, denser air. If the lift is substantial, precipitation can occur. Since stationary fronts do not move quickly, an extended precipitation duration may lead to flooding.
6.5.6 Norwegian Cyclone Model Life Cycle Front
The Norwegian cyclone model has a particular life cycle that storm systems undergo. This life cycle has these stages:
- Initial conditions
- Beginning stage
- Intensification
- Mature stage
- Dissipation
Initial conditions are for a stationary front to exist. Cold air is on one side and warm air is on the other side. Winds are generally parallel to the front as is shown in these illustrations. The first illustration is a weather map view as if looking at it from above. The second illustration is a three-dimensional view. Both views represent the same conditions, just with a different perspective.
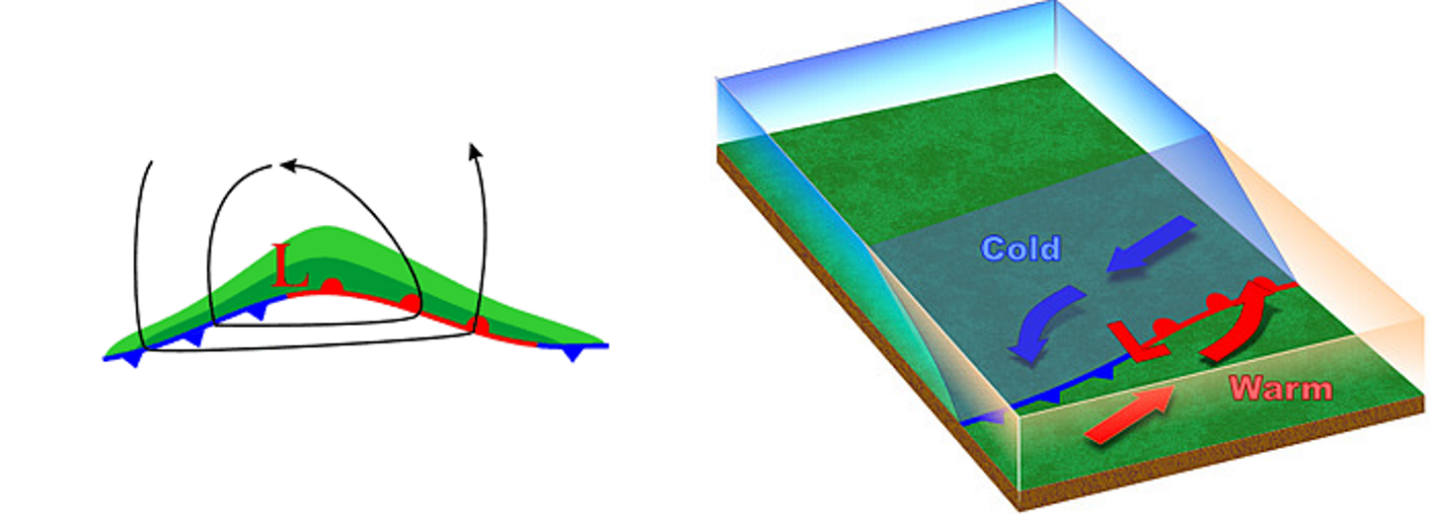
The beginning stage is a wave or kink that develops on the stationary front. This kink is associated with a weak surface low pressure. Winds start to move cyclonically around this low pressure with a cold and warm front forming. Precipitation will begin to develop with the heaviest near the low center. These illustrations depict this beginning stage. The green area indicates precipitation in the map view (left one) with the heaviest along the front (dark green). The black lines in the map view are isobars.
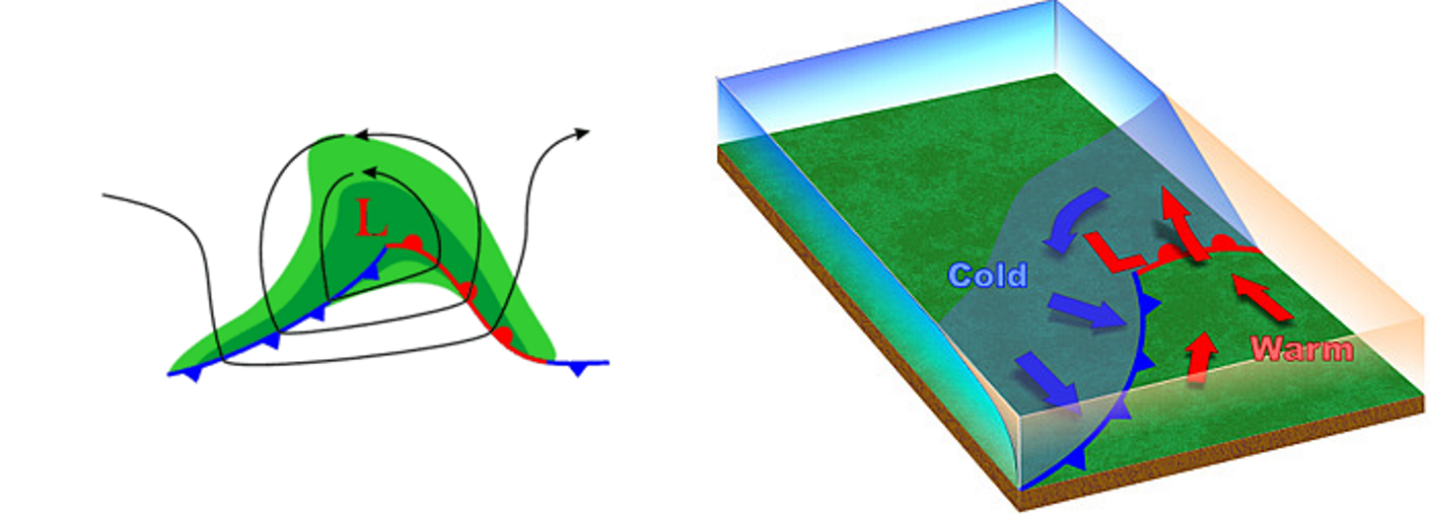
Intensification sees the low pressure deepening along with well-defined cold and warm fronts. Winds are northerly behind the cold front and southerly behind the warm front. The area of precipitation has expanded with the heaviest precipitation still associated with the low center. These illustrations depict this stage in the life cycle.
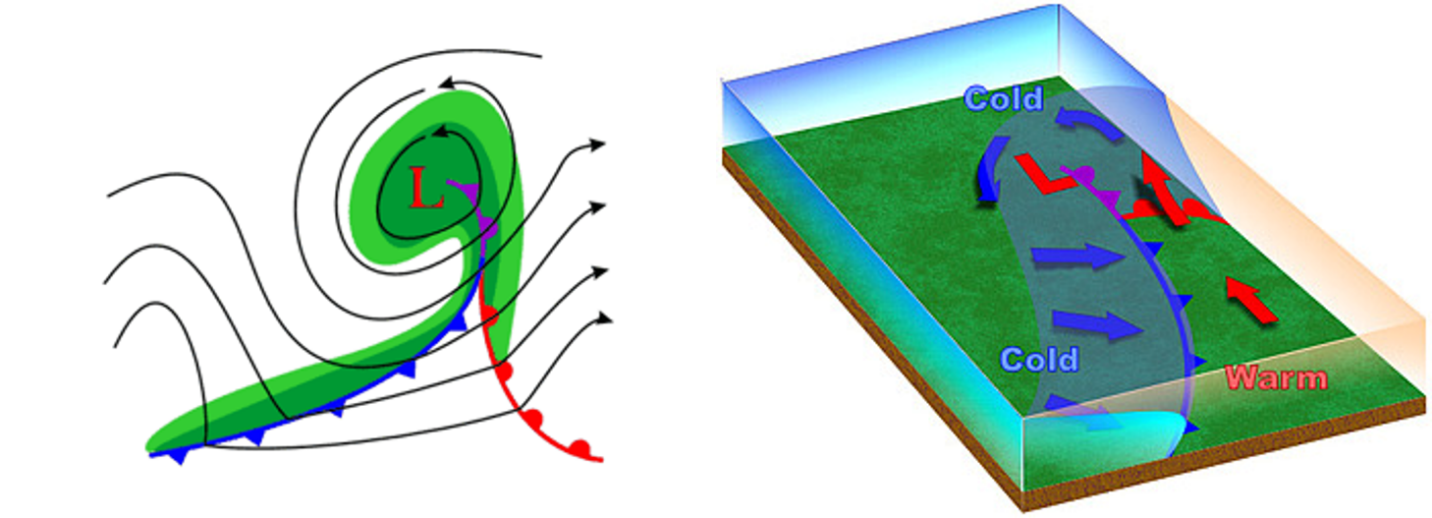
The mature stage has the cold front starting to lift the warm air aloft, which is the beginning of an occluded front. The low-pressure center stays with the formation of the occlusion. Precipitation wraps around this low center. These illustrations depict the mature stage.
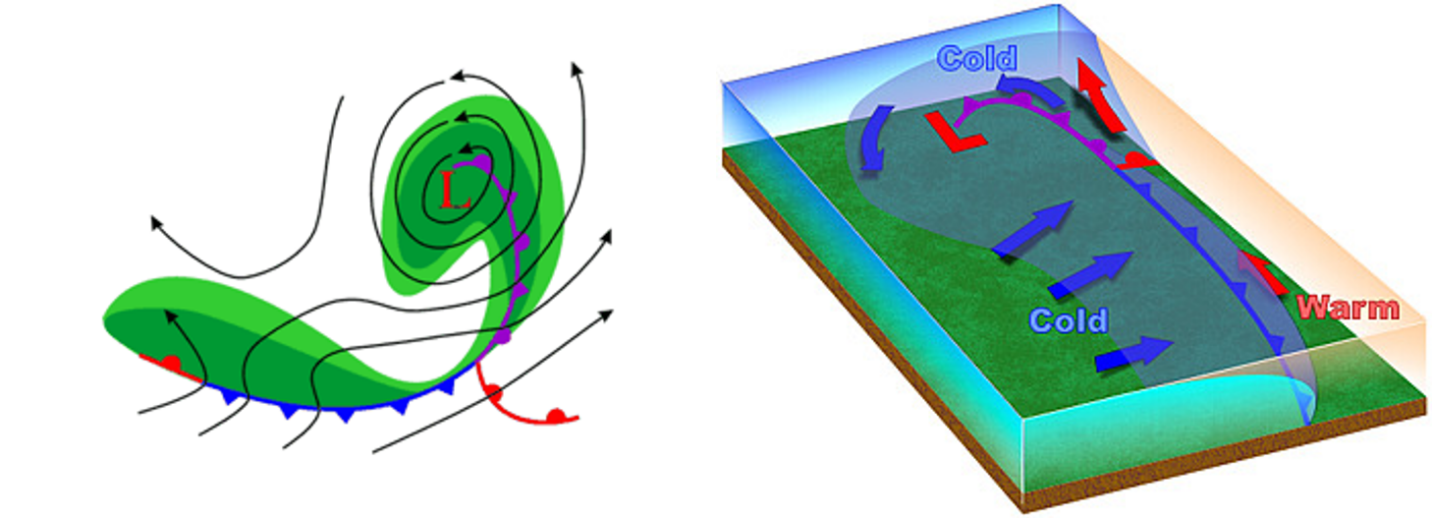
Dissipation occurs as the cold front continues to advance on the warm front. The occluded front lengthens which eventually removes the supply of warm, moist air. The low pressure weakens and gradually dissipates. These illustrations depict the final dissipation stage of the storm system.
Video: Mod 6.5.6 Norwegian cyclone model life cycle ( 3:34 min.)
This video describes the life cycle of a storm system using the Norwegian cyclone model.
Module 6.5.7 Other Boundaries Found on a Surface Map
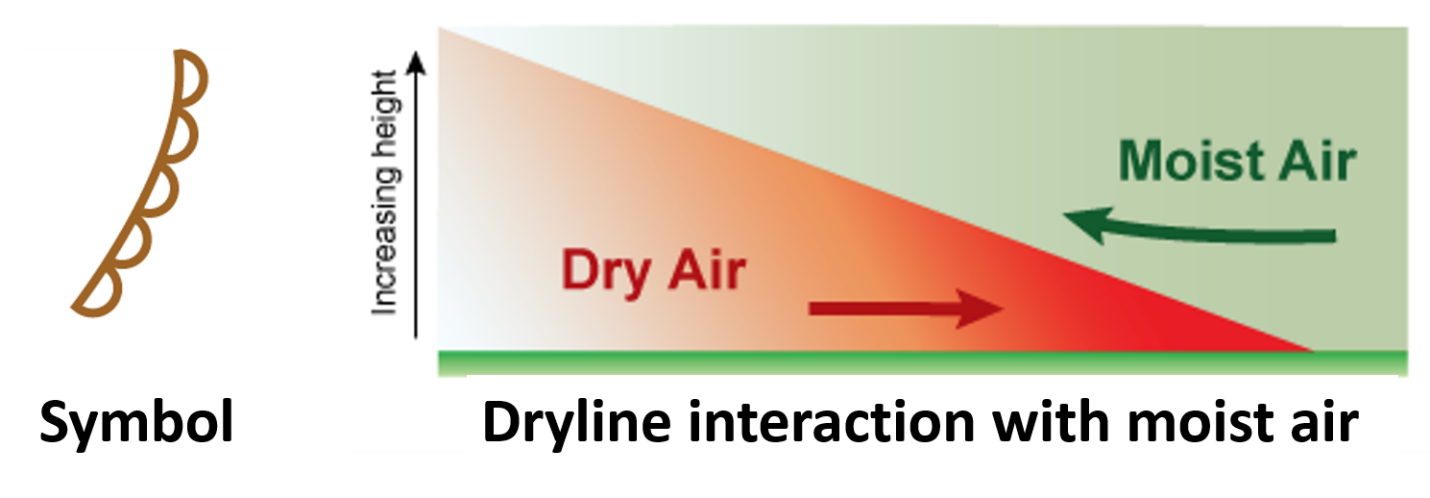
Three other boundaries are seen on weather surface analysis maps in the United States. These boundaries are a dry line, squall line, and a trough. A dry line marks the boundary between a moist air mass and a dry air mass. It typically lies north-south across the central and southern high Plains states (NM, CO, TX, KS, and OK) during the spring and early summer, where it separates moist air from the Gulf of Mexico (to the east) and dry desert air from the southwestern states (to the west).
The dry line typically advances eastward during the afternoon and retreats westward at night.
A dry line passage results in a sharp drop in humidity, a rise in temperatures, clearing skies, and a wind shift from south or southeasterly to west or southwesterly. These changes occur in reverse order when the dry line retreats westward.
Which is heavier, dry air or moist air? We know colder air is denser (or weighs more) than warm air; thus, colder air always slides under warmer air when the two collide. To determine how dry and moist air interact, we need to know which one weighs more. This question can be answered by looking at the molecular weights of air and water. From Module 1, we know that air is largely comprised of 78% nitrogen and 21% oxygen. Taking the molecular weights of N2 (28) and O2 (32) along with their percentages (0.78 and 0.21) gives a molecular weight of dry air as 29. Water (H2O) has a molecular weight of 18 (2 + 16). Water vapor is much lighter than air. Therefore, dry air with little or no moisture will be heavier than moist air.
Since drier air weighs more than moist air, as the dryline moves east it lifts moist air. Therefore, severe and sometimes tornadic thunderstorms can develop along a dry line or in the moist air just to the east of it. A dry line is represented by a brown line with unfilled half circles on the side that the dry air is moving towards. These illustrations depict the dry line symbol and how it interacts with moist air.
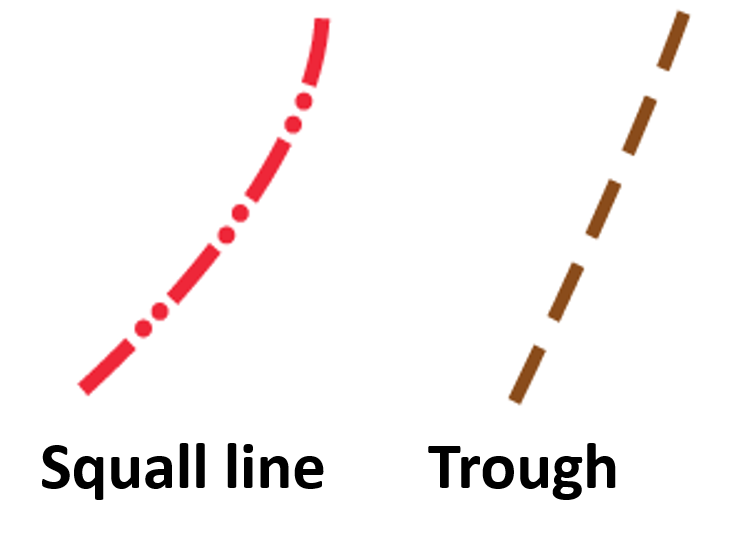
The second boundary seen on surface maps is a squall line. A line of thunderstorms that moves ahead of an approaching cold front is called a squall line. A squall line only proceeds a cold front when certain atmospheric conditions are present. A secondary line of weaker thunderstorms or showers would then be associated with the actual cold front passage. Squall lines will be discussed in more detail in Module 9.
The third symbol commonly depicted on surface weather maps is a trough. A trough is an area of low pressure aloft. This definition is the same one used in Module 3, so no new terminology here. The wind changes direction across a trough, but there is not a change in air mass. While not specifically a surface boundary, troughs reflect a change in atmospheric conditions aloft. Hence, troughs can be areas where clouds and precipitation may form. The symbols for a squall line and trough are illustrated to the right.
Current surface front analyses for the United States can be seen on the National Oceanic and Atmospheric Administration (NAOA) website.
References:
NH-stationary-front.png – From The COMET Program and has their copyright embedded.
stationary-frontal-zone.gif – Under Creative Commons 4.0, Meteo3 Course Author: Steven Seman (Assistant Teaching Professor, Department of Meteorology and Atmospheric Science, College of Earth and Mineral Sciences, The Pennsylvania State University). Some portions were adapted from original course materials by David Babb and Lee M. Grenci. Material can be found at https://www.e-education.psu.edu/meteo3/l6_p9.html
NH-occluded-front.png – From The COMET Program and has their copyright embedded.
cold-occ.png, warm-occ.png and portions of the text are in the public domain from NOAA, NWS and can be found at https://www.weather.gov/jetstream/wxmaps
occluded-front-precip.png – ” Occluded Fronts and Midtropospheric Fronts” by Roland Stull, LibreTexts is licensed under CC BY-NC-SA and is found at https://geo.libretexts.org/Bookshelves/Meteorology/Book%3A_Practical_Meteorology_(Stull)/12%3A_Fronts_and_Airmasses/12.05%3A_Section_6-. Clipped image to only use the cloud and precipitation portion.
All of the images and a portion of the text is in the public domain at NOAA, NWS and can be found at https://www.weather.gov/jetstream/cyclone
All images and portions of the text are in the public domain and are from NOAA, NWS at https://www.weather.gov/jetstream/wxmaps Modifications to the images were to add labels.
