6.3 Synoptic Scale
6.3 Synoptic Scale
A time averaged westerly flow aloft in the midlatitudes agreed with the three-cell conceptual model. However, looking at a single time frame for a day did not show a zonal westerly flow. Rather troughs and ridges were shown across the globe, as was shown in this chart previously.
These troughs and ridges are no longer a global scale phenomenon, but fall into the synoptic scale category. For example, the ridge of high pressure over the United States covers a portion of the continent. These synoptic scale features are discussed in this section, starting with jet streams.
6.3.1 Jet Streams
Jet streams are relatively narrow bands of strong wind in the upper levels (9 to 15 km) of the troposphere.The winds generally blow from west to east in jet streams. Jet streams follow the boundaries between the hot and cold air. Since these hot and cold air boundaries are most pronounced in winter, jet streams are the strongest during the winter months.
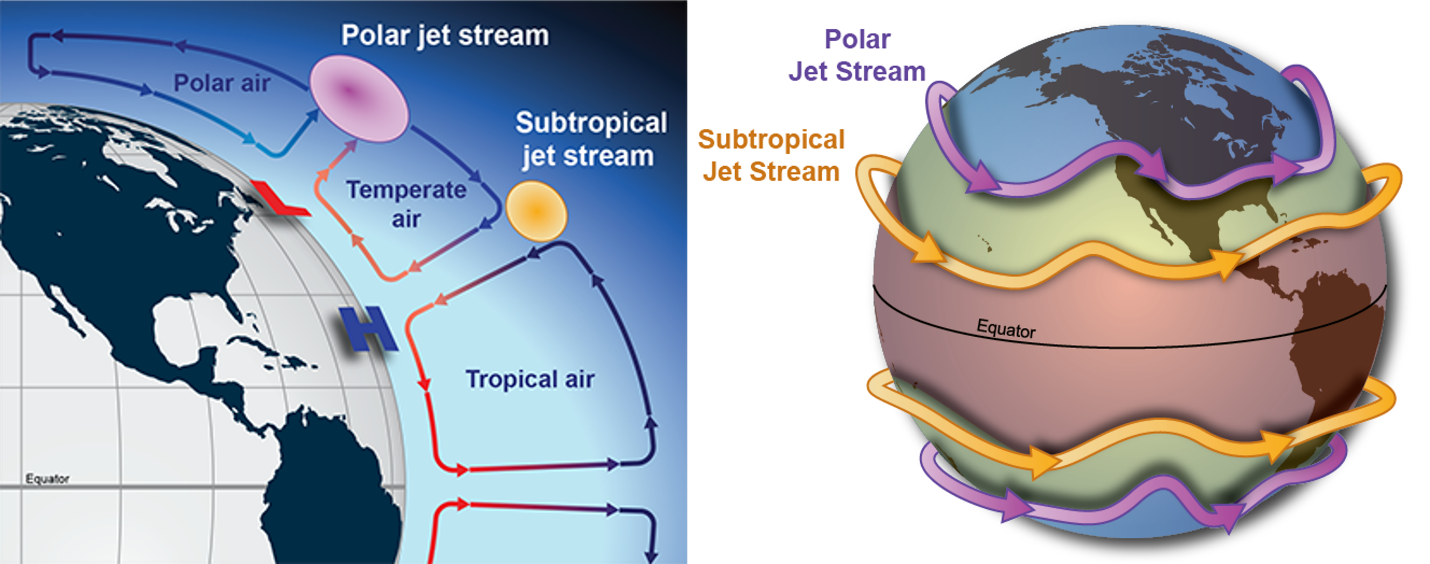
The boundaries between the three global circulation cells is where the temperature changes are the greatest. Hence, jet streams tend to follow these boundaries near latitudes 30o and 50o to 60o. The jet stream closest to the equator is called the subtropical jet and the one closest to the pole is called the polar jet.
Jet streams meander around the globe, dipping and rising in altitude and latitude, splitting at times, and even disappearing altogether to appear somewhere else. Additionally, the subtropical and polar jets may merge into one. This erratic nature is partially illustrated in this next diagram.
This graphic illustrates these locations and this naming convention.
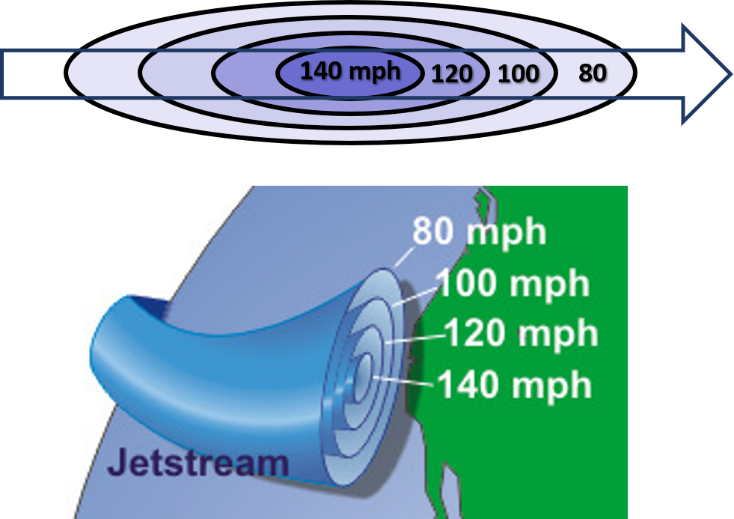
However, unlike the above diagram, jet streams do not have a constant speed around the globe. Instead, the wind increases towards a central core of greatest strength and then weakens into the general wind field, and then strengthens again. This next illustration shows how the wind speed varies within the jet stream.
Video: What is a jet stream and how does it affect the weather? (5:25 min.)
This video from the United Kingdom Met Office discusses the origin of jet streams and how they may affect the weather.
6.3.2 Rossby Waves
Rossby waves, also known as planetary waves, are the flow pattern between troughs and ridges in the midlatitudes. These waves occur naturally in rotating fluids within Earth’s atmosphere and oceans. The atmosphere behaves very much like a fluid, although it is considerably less dense than water in an ocean. These waves form as a result of the rotation of our planet. Rossby waves help transfer heat from the tropics toward the poles and cold air toward the tropics in an attempt to equalize temperatures across the Earth. They determine the location of the jet stream and influence the track of surface low-pressure systems. Rossby waves are named after Carl Rossby who determined the mathematics describing them.
Rossby Waves in Motion
This animation from NASA’s Goddard Space Flight Center shows Rossby waves in motion. The jet stream is represented by the speed of the wind ranging from the slowest (light blue colors) to the fastest (dark red). The time period covered by the animation is about 30 days in June and July of 1988.
Video: Mod 6.3.2 Rossby wave animation (0:27 min.)
Longwaves and Shortwaves
These waves in the midlatitudes can be categorized into two sizes (1) longwaves which cover around 3700 to 5000 miles and (2) shortwaves which are less than 3700 miles in length.
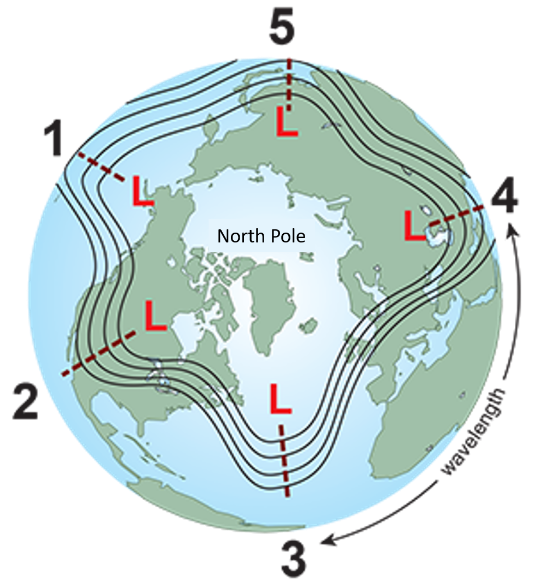
The number of longwaves at any one time in a hemisphere varies from 3 to 7, though it is typically 4 or 5.
This figure depicts 5 longwaves.
Longwaves move slowly from west to east or can be stationary for several months or can retrograde towards the west. Whatever movement they exhibit, it is always slow. Their slow-motion often results in fairly long persistent weather patterns in the midlatitudes. For example, locations between the trough and the downstream ridge can experience extended periods with rain or snow while at the same time 1,500 – 2,000 miles upwind and downwind the weather is very dry.
Shortwaves are embedded within longwaves and are much faster moving with an average speed of 23 mph. Shortwaves are the chief instigator of episodes of precipitation. Their main precipitation bands will be typically localized near the short wave as it passes overhead.
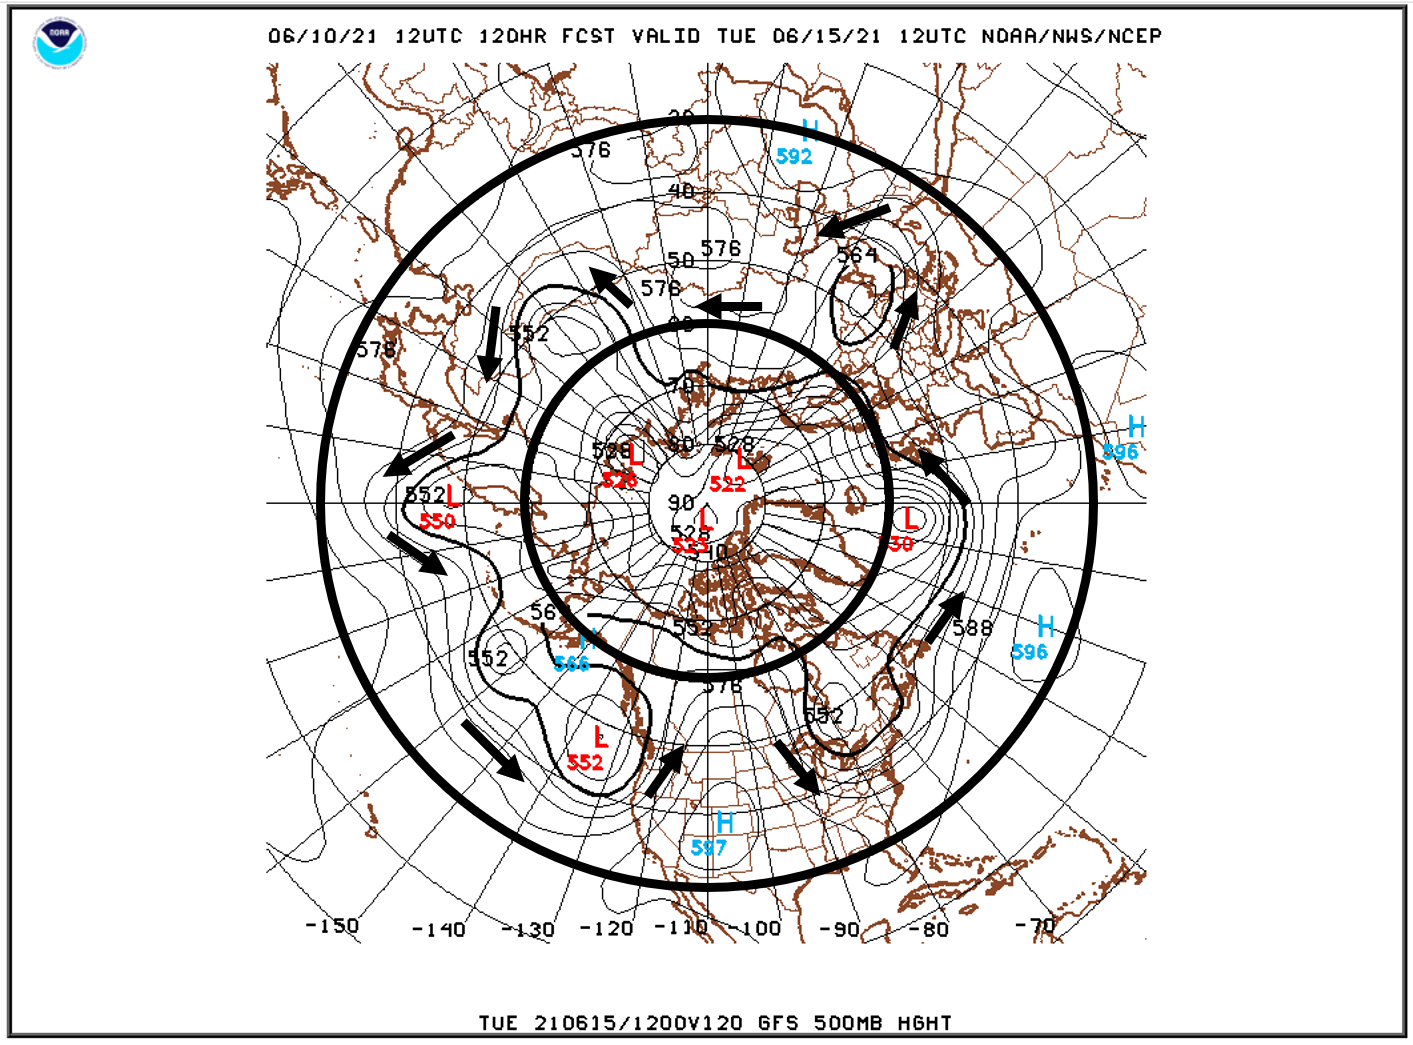
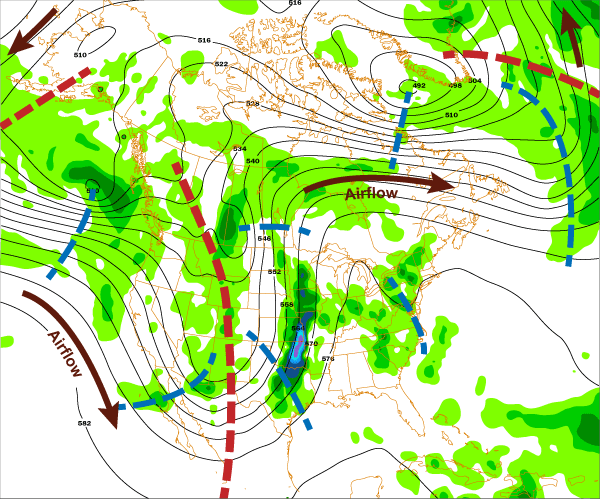
500 mb Chart
To the right is an example of a 500 mb chart.
- The height contours are in black.
- The brown arrows indicate the direction of airflow.
- The large red dashed lines represent the location of the longwave troughs.
- The shorter blue dashed lines represent the location of the more prominent shortwaves.
- The green areas represent precipitation amount with the light green at 0.01 inches.
The areas of precipitation are mainly associated with the shortwaves as they pass through the longwaves. Like railroad cars on a train track, shortwaves will generally follow the height contours.
6.3.3 Atmospheric Rivers
Atmospheric rivers are relatively long, narrow regions in the atmosphere that transport water vapor from the tropics to higher latitudes. On average, atmospheric rivers are 250 to 370 miles wide. These bands of water vapor interact with Rossby waves and their associated subtropical jet streams. When an atmospheric river encounters land, it often releases this water vapor in the form of rain or snow. A strong atmospheric river transports an amount of water vapor roughly equivalent to 7.5–15 times the average flow of water at the mouth of the Mississippi River.
This seven day animation from January 2017 shows an atmospheric river moving from the tropics onto the West Coast of the U.S. and Mexico. The color key is in centimeters of liquid water present in a vertical column of atmosphere. This column is from the surface to the top of the atmosphere.
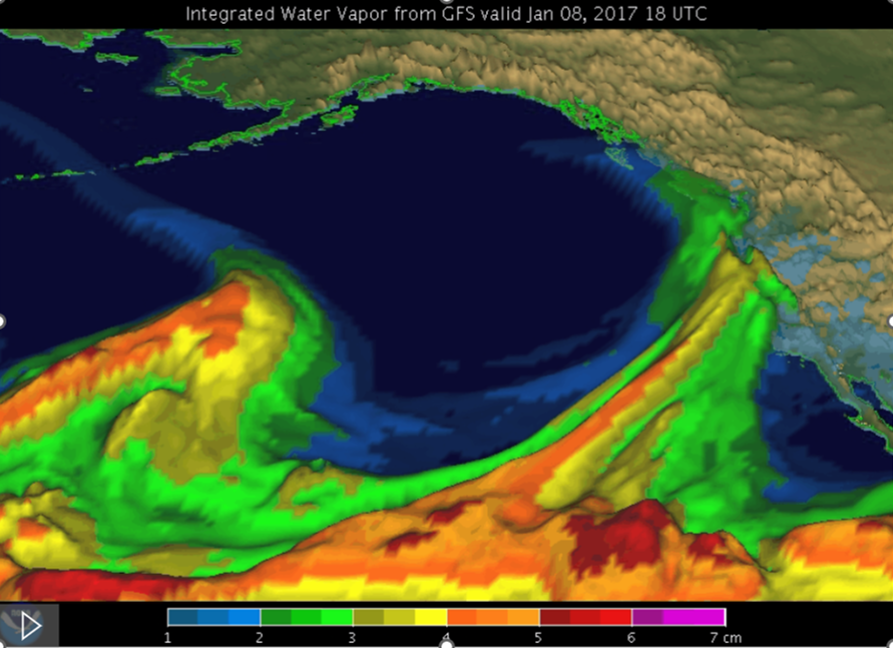
Although atmospheric rivers come in many shapes and sizes, those that contain the largest amounts of water vapor and the strongest winds can create extreme rainfall and floods. These events can disrupt travel, induce mudslides, and cause catastrophic damage to life and property. Many times, a strong atmospheric river is referred to as a “Pineapple Express,” since it brings moisture from the tropics near Hawaii to the North American West Coast. Additionally, atmospheric rivers have impacted other countries such as the United Kingdom, Norway, Chile in South America, and Australia.
Video: Tracking Pathways of Atmospheric Rivers (2:59 min.)
This video from the Bureau of Reclamation examines atmospheric rivers and how they may affect the water supply in the western U.S.
References:
6-10-21 500mb.png – Public domain from https://mag.ncep.noaa.gov/model-guidance-model-area.php# Modified to add latitude circles and arrows to indicate wind.
Images and portions of the text are in the public domain from NOAA, NWS at https://www.weather.gov/jetstream/jet
Some portions of the text are from NOAA, NOS at https://oceanservice.noaa.gov/facts/rossby-wave.html
rossby-wave.mp4, 5 wave pattern.png and short_long_precip.png, and portions of the text are from NOAA, NWS at https://www.weather.gov/jetstream/longshort
atmospheric-river-9jan2017.gif – Public domain from NOAA, PSL at https://psl.noaa.gov/arportal/about
Portions of the text are in the public domain from these NOAA web sites:
