6.2 Global Scale
Global Scale
A spatial imbalance between radiative inputs and outputs exists on the Earth. The Earth loses energy at all latitudes due to outgoing longwave radiation. Near the tropics, more solar radiation enters than leaves. Near the poles more radiation leaves than is received. The result is differential heating, creating warm equatorial air and cold polar air. This imbalance drives the global scale general circulation of wind which is unceasing.
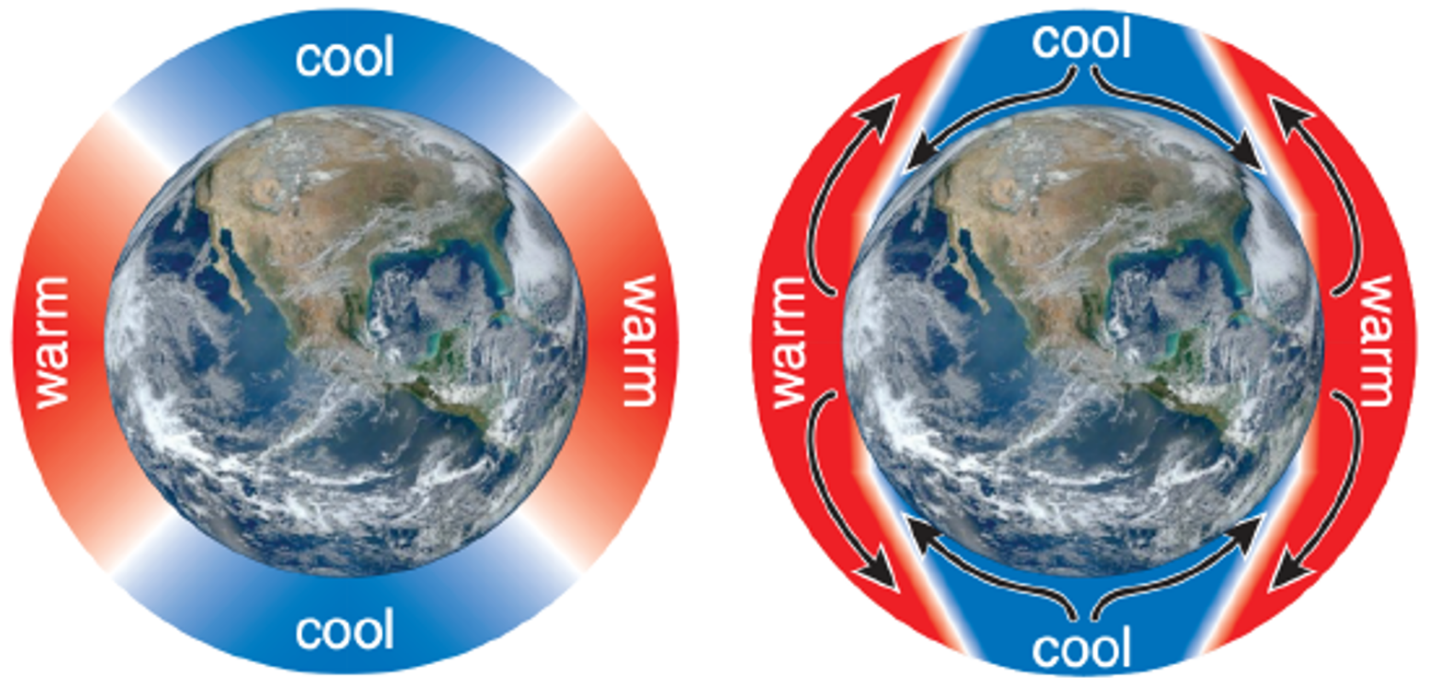
People have known about the cold north and warm tropics for a long time. A simple concept to equalize these temperatures is to move the cold air south and the warm air north. When buoyancy is considered, the warm air would be aloft and the cooler air near the surface.
In 1735, George Hadley understood that solar radiation drives all weather. He proposed that the surplus of heating at the equator would flow towards the poles. This single-cell migration of energy in both hemispheres was proposed to explain the trade winds. The Hadley cell or the single-cell model was trying to take this differential heating and balance it, while fitting in the observations of the trade winds and rising air near the equator.
In 1856, William Ferrel proposed a circulation in the midlatitudes with westerly winds as the middle of three circulation cells in each hemisphere. This three-cell model is in use today and is described in the next section.
Watch This Video
This short video from the United Kingdom Met Office explains the causes of the global circulation. England’s Met Office is equivalent to the United States’ National Weather Service.
What is global circulation? | Time: 2:50
6.2.1 Three Cell Model
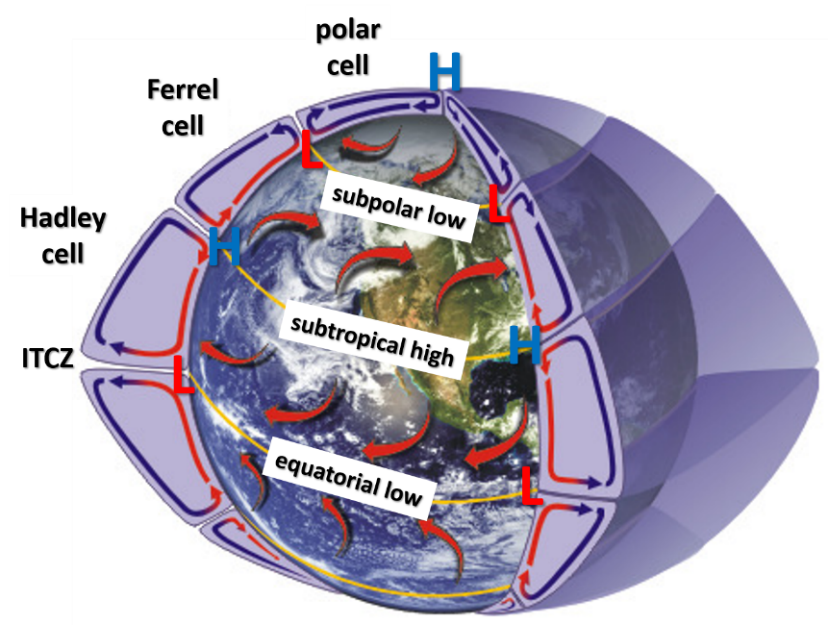
The three-cell model has three meridional circulations in both the Northern and Southern Hemisphere. This diagram illustrates the three-cell model.
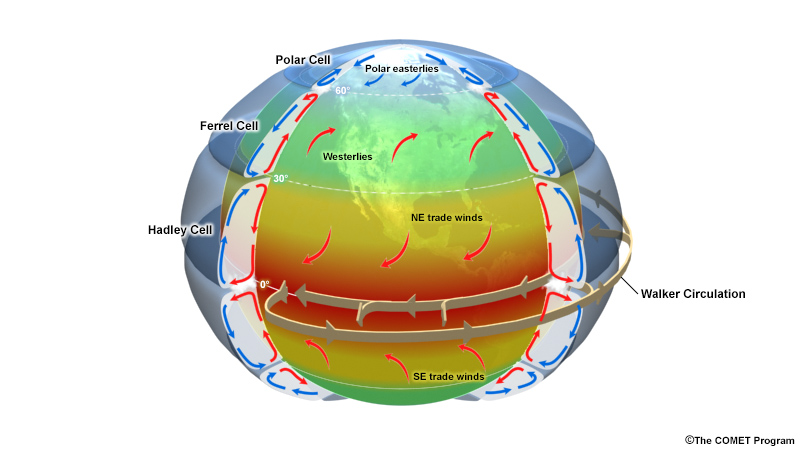
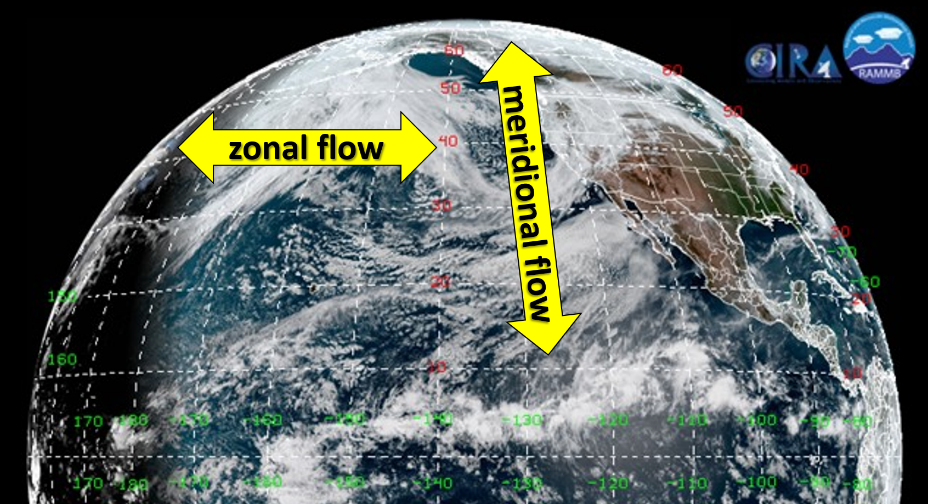
The Hadley cell circulates air between the tropics and subtropics (0o to 30o latitude). The Ferrel cell circulates air in the midlatitudes. The midlatitudes extend from 30o to 60o latitude. The weak third circulation cell from 60o latitude to the pole is called the polar cell. Before examining these cells in more detail, two new terms must be introduced. Zonal flow occurs when the wind is parallel to the latitude lines. Zonal flow describes winds with an east or west direction. Meridional flow occurs when the wind is parallel to the longitude lines or meridians. Meridional flow describes winds with a south or north direction. This figure illustrates these two types of flow.
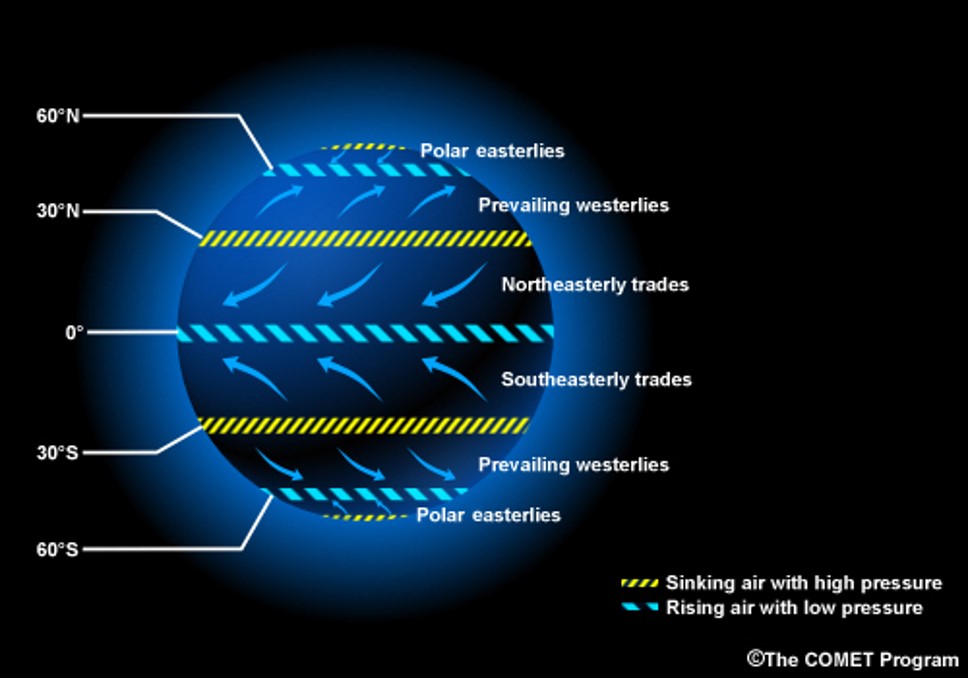
Associated with these cell circulations are regions of upward and downward air motions. Near the equator where the Hadley cells from each hemisphere collide is a region of upward motion. The pressure gradient force is active in all of these air motions. Thus, a region of ascending air is physically linked to a persistent surface low pressure. Where the Ferrel and Hadley cells meet near 30o is associated with descending air and a persistent surface high pressure. Where the Ferrel and polar cells meet is another area of ascending air and another low surface pressure. This figure illustrates these regions of vertical air motion between the cells.
On a hypothetical planet with no contrast between the land and oceans, the long-term average winds would closely resemble the three-cell model. Actual winds on any day may differ due to transient weather systems, but the long term average would remain intact. Seasonal variations would still be present as the temperature contrasts shift north and south.
Video: What is Global Circulation Part Two – The Three Cells ( 3:35 min.)
This video from the United Kingdom Met Office describes the global circulation on our rotating planet.
6.2.2 Hadley Cell and the ITCZ
The Hadley cell consists of hot air rising near the equator. This rising air forms a low pressure at the surface called an equatorial low. After the air rises, it moves poleward and eventually descends around 30o. This area of descending air is called the subtropical high since a persistent surface high pressure resides at this latitude. To complete this circulation, surface winds move from 30o back towards the equator. This circulation forms a convection cell that dominates the tropical and sub-tropical regions.
The Coriolis force turns these large-scale air movements towards the right. Surface winds in the Northern Hemisphere are from the northeast and from the southeast in the Southern Hemisphere. These winds are referred to as the Trade Winds due to their extensive use by sailing ships crossing the oceans.
The equatorial low assists in creating a convergence area associated with thunderstorms and heavy precipitation called the intertropical convergence zone (ITCZ). The ITCZ roughly forms a band that circumnavigates the Earth near the equator where the northeast and southeast trade winds from each hemisphere converge. Sailors have often referred to this area as the doldrums due to its generally light winds. Yet, the ITCZ is an important part of the global circulation as it forms the ascending branch of the Hadley circulation. This entire pattern is driven by incoming solar radiation, which peaks near the Equator.
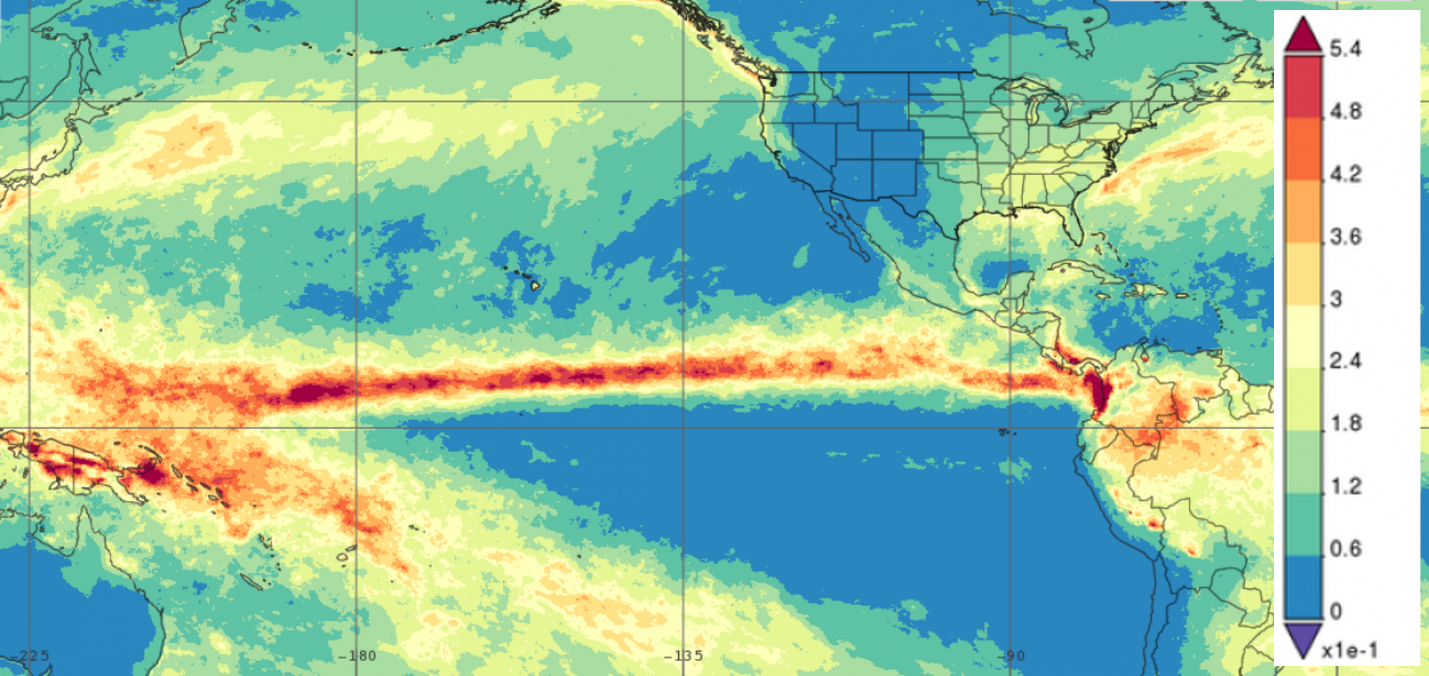
This rising moist air in the convergence zone condenses and releases latent heat, which further drives upward motion. Locations under the ITCZ can experience some of the heaviest rainfall rates on Earth. Clouds and precipitation form revealing the ITCZ as a band of rainfall that wraps around the Earth near to the Equator. This satellite precipitation estimate from NASA highlights the ITCZ well. The precipitation values are in mm per hour and the red band is associated with the ITCZ.
Visible satellite imagery across the Pacific Ocean frequently has an ITCZ which is easy to find, as this next picture demonstrates. The ITCZ is circled in red. Portions of the ITCZ intensify and decay throughout a year, but sections are always visible somewhere on the globe.
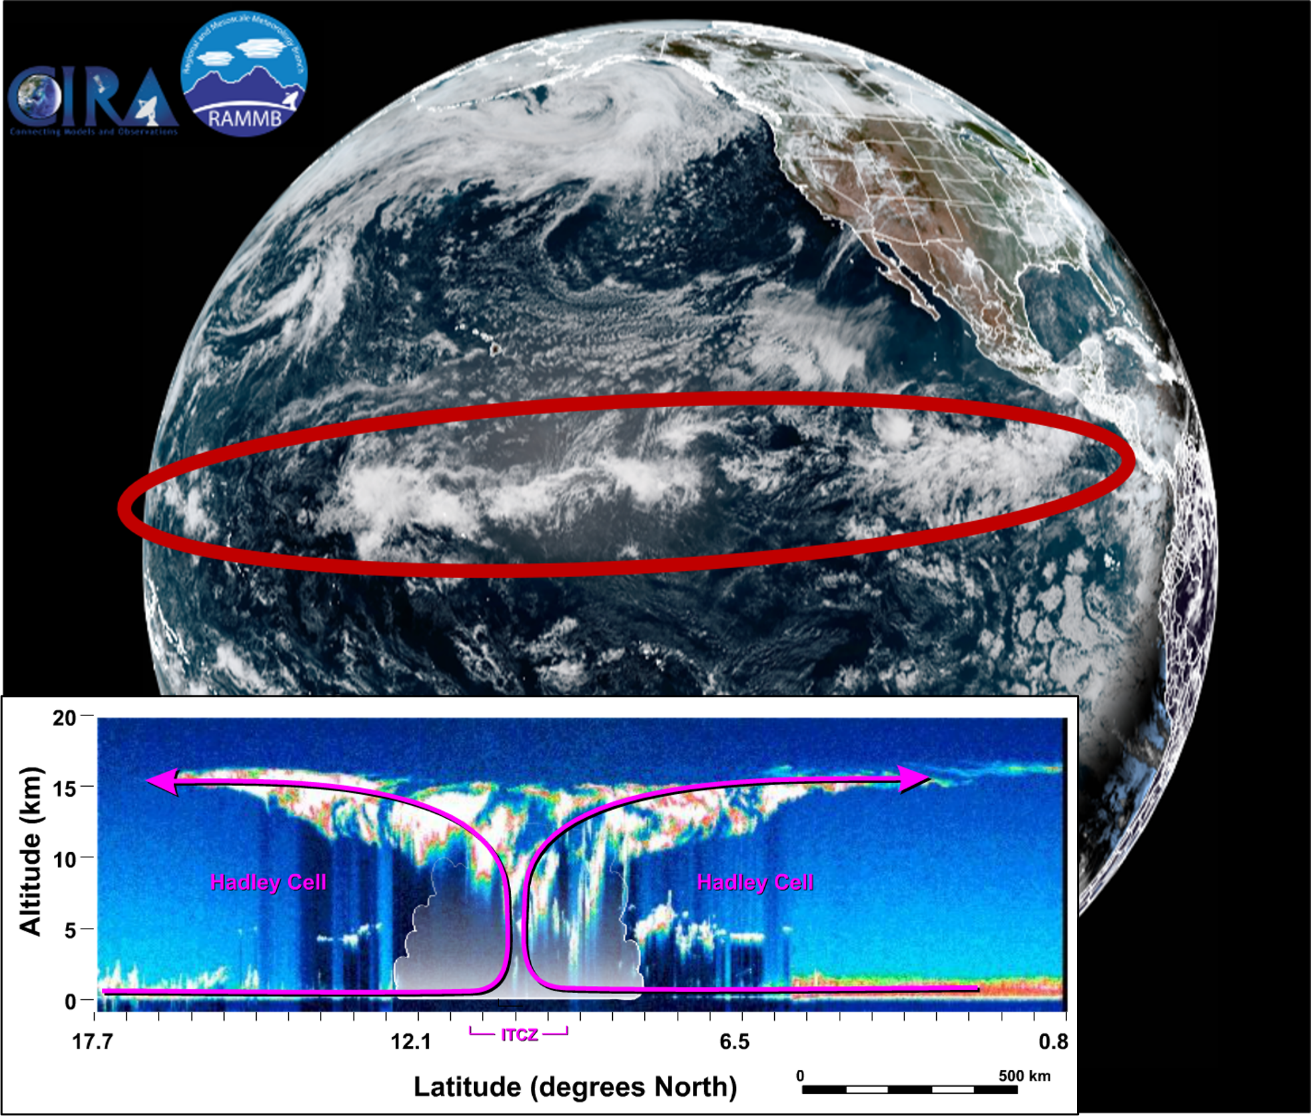
The last image in this section is a cross-section of the atmosphere and shows the vertical structure of the ITCZ. A cross-section is defined as a vertical slice of the atmosphere across a linear distance. Additionally, the ITCZ has a seasonal shift between 15oN and 15oS towards the hemisphere experiencing summer and can wander even further at times.
This video examines the Hadley cell and the ITCZ. Since the Hadley cell is centered near the equator, it covers a much larger percentage of the Earth’s surface than the other cells.
The subtropical high is associated with descending air located between the Hadley and Ferrel cells around 30o latitude. This surface high pressure area is semi-permanent. As the air descends in altitude, it compresses and warms. These conditions discourage condensation and many areas near the subtropical high are deserts or have dry climates due to the subtropical high. A vegetation map of Africa highlights the effects of the subtropical high at the surface.
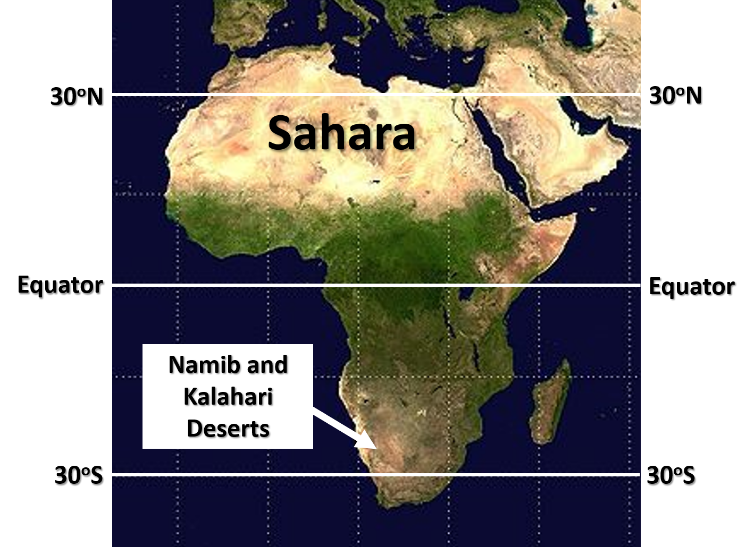
The Sahara, Namib and Kalahari Deserts are all a result of this semi-permanent subtropical high. Likewise, the lusher vegetation near the equator is a result of the precipitation associated with the ITCZ.
The subtropical high is characterized by calm winds and sunny skies, and is sometimes referred to as the horse latitudes. The term comes from ships sailing to the New World that would often become stalled for days or even weeks when they encountered the calm winds. Many of these ships carried horses to the Americas as part of their cargo. Unable to sail and resupply due to lack of wind, crews often ran out of drinking water. To conserve scarce water, sailors on these ships would at times throw the horses they were transporting overboard. Thus, the phrase ‘horse latitudes’ was born.
In the Ferrel cell, the air flows poleward from the subtropical high to a surface subpolar low near 60o. The Coriolis force again shifts these winds towards the right into a zonal flow pattern. The Coriolis force is balanced with the pressure gradient force. These winds are referred to as the westerlies since they originate from the west. Whereas the Hadley cell is driven directly by solar radiation (convection), the Ferrel cell is an indirect circulation as a result of the polar and Hadley cells. You could think of the Ferrel cell as going along with the flow, since it is stuck in the middle.
A subpolar surface low resides between 50o and 70o latitude with ascending air. Air motion aloft in the polar cell is towards the pole where it descends. A surface high pressure resides at the pole called the polar high. Air motion at the surface is equatorward. Since many transient weather systems pass through this area, the polar cell is barely detectable when examining average cross sections of the Arctic. The polar cell is a thermally driven circulation caused by the temperature differences between the pole and lower latitudes.
Video: What is Global Circulation Part 3 – The Coriolis effect & winds
(6:18 min.)
This third video from the United Kingdom Met Office describes how the Coriolis force influences the global circulation patterns and the winds within each cell. The concept of jet streams is also examined.
6.2.4 Three Cell Model Reality Check
How well does the three-cell model fit what is actually observed? To answer this question, a good first step is to examine the average sea-level pressure maps across the globe. Since a seasonal variation is likely present, examining maps for the months of July and January will provide details on these variations. This first average sea-level pressure map (SLP) is for July is given below.
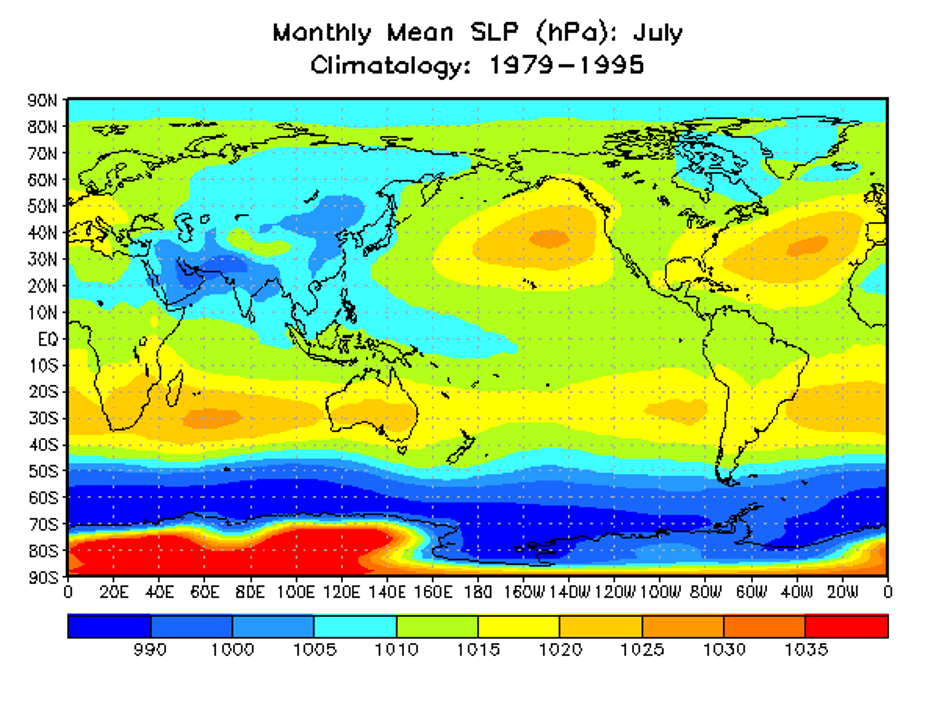
On this map, the warm yellow to red colors are higher pressure and the cool bluer colors are lower pressure. The lime green areas essentially depict the areas of neither high nor low-pressure values.
Looking at the Southern Hemisphere first. The Antarctic has a strong high pressure over the pole with a strong low pressure around 60oS. This surface pressure pattern fits the polar high and subpolar low extremely well. Moving equatorward, the subtropical high near 30oS is again depicted well. Near the equator, we should see a band of lower pressure associated with the ITCZ. Lower pressure blue colors are present across the western Pacific Ocean into Asia and Africa, but not elsewhere. Normal rather than lower pressures are present in the eastern Pacific and Atlantic Oceans and across South America.
Examining the Northern Hemisphere, the subtropical high can be seen closer to 40oN across the eastern Pacific and Atlantic Oceans into Europe, but not so much across Asia. The subpolar low is present with slightly lower pressures across 70oN. The surface polar high near the pole is not seen.
This next average sea-level pressure (SLP) map is for January.
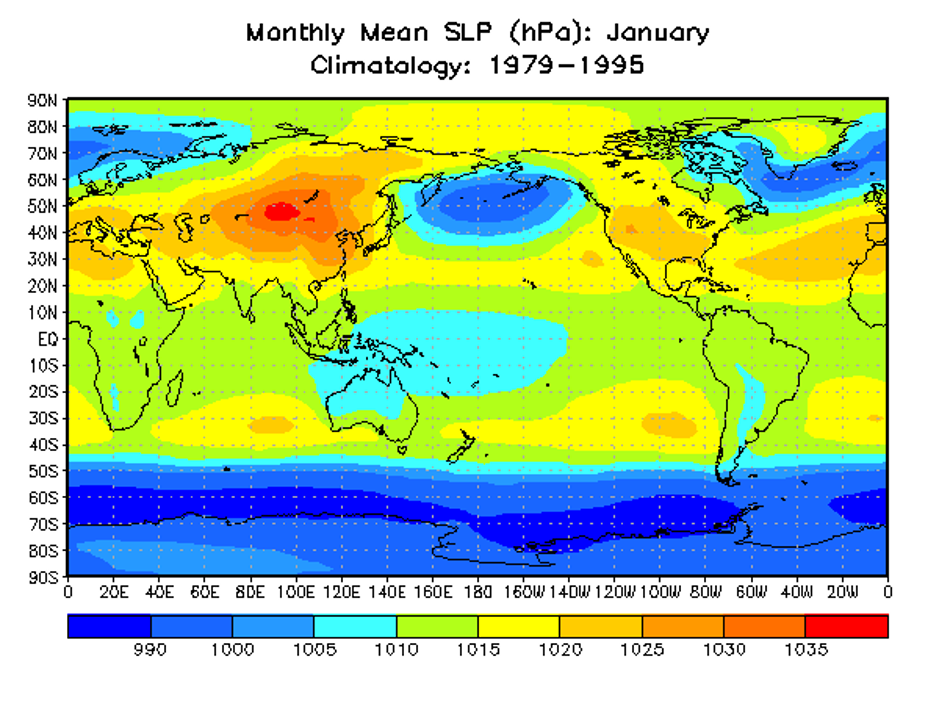
Starting the analysis with the Southern Hemisphere again. No polar high is present in the Antarctic, instead, an area of low pressure extends from 50oS to the pole. The large low pressure certainly encompasses the area where the subpolar should be present. At about 35oS the subtropical high can be seen. Low pressures associated with the equatorial low or ITCZ are present in the western Pacific Ocean near Indonesia and Africa. The ITCZ is not seen in the Atlantic nor Indian Oceans. North of the equator, high pressure is observed around 30oN with a huge high pressure over Asia. Subpolar low pressures are shown at 50oN in the northern Atlantic Ocean near Iceland and the Pacific Ocean. The land masses of Asia and North America do not indicate subpolar low pressures. No Arctic high pressure is present at the pole.
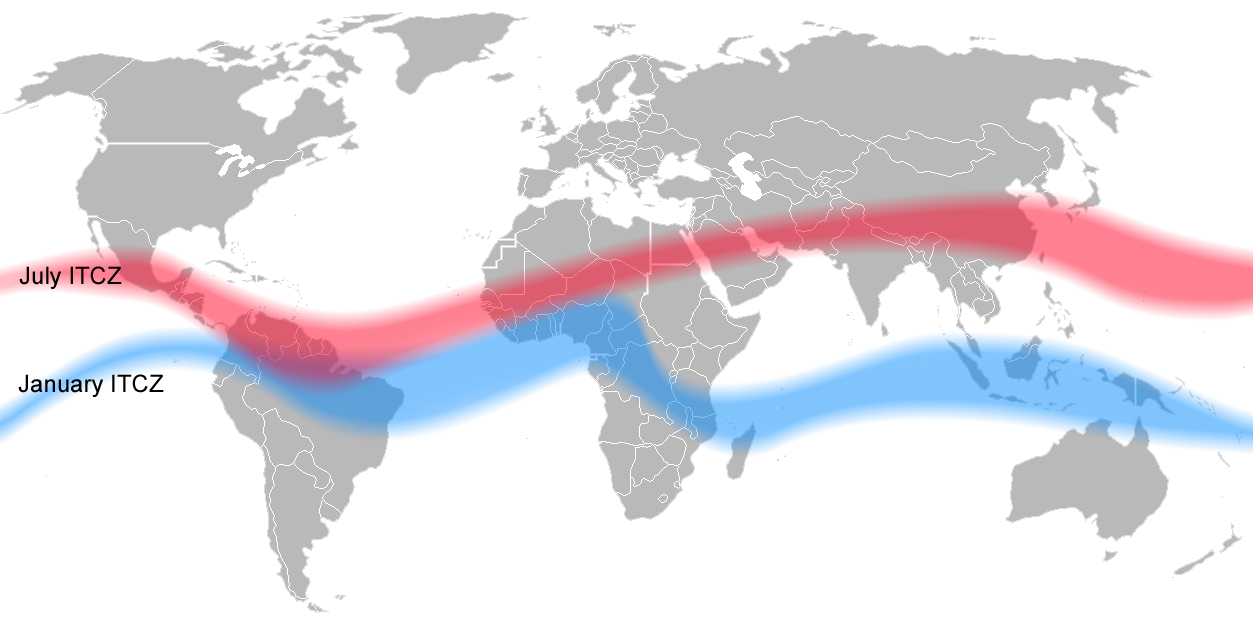
One last map will help us complete this surface analysis. This map contains the average location of the ITCZ for January (blue) and July (red). This map helps explain some of the variability noted in the sea-level pressure maps. The ITCZ seasonally wanders across the western Pacific and Indian Oceans, Asia, and eastern Africa. This convective zone shifts much less from west Africa, across the Atlantic Ocean, and into South America.
As you can see from these analyses, the three-cell model fits some of what it describes well but does not account for everything. The July (winter) surface patterns in the Southern Hemisphere are the closest match. Many of these variations from what the conceptual model predicts are due to the land masses. The Southern Hemisphere is largely water. This flat water surface allows air to move with few disruptions. The Northern Hemisphere has most of the landmass on our planet. As the air flows over vegetation, hills, and mountains, the atmosphere adjusts to these obstacles accordingly.
6.2.5 Upper Level Characteristics
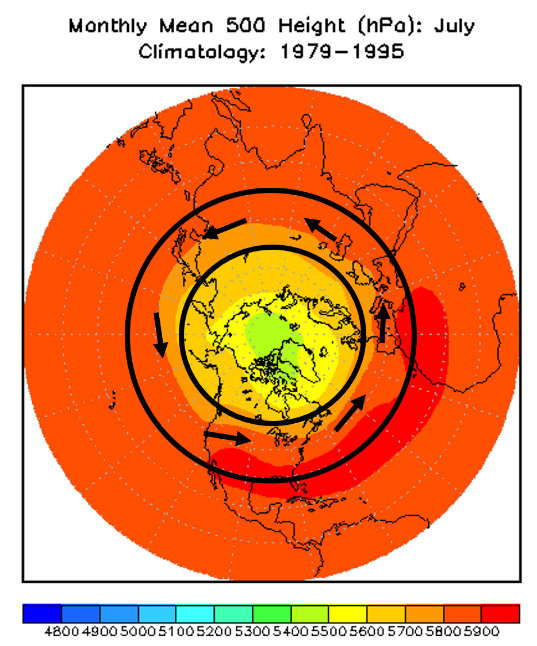
The reality check of the three-cell model so far has centered on surface analyses. How does this model relate to upper level analyses? The next figure is a 500 mb height average for July in the Northern Hemisphere. Each different color on this map is a 100 meter change in the height field. The larger black circle is 30oN and the smaller circle 60oN. From the equator to 30oN the height field does not change much; it is orange across most of the area. Remember the height gradient translates to the pressure gradient and a corresponding wind speed. Little change in the height field indicates winds are light. Since the surface pressure gradient also indicates lighter winds, the winds aloft appear to balance the surface winds in the Hadley cell. The Ferrel cell in the middle should have the westerlies. Wind flows parallel to the height field as is indicated by the arrows. These winds agree with the three-cell model expectations. The lowest heights are at the North Pole with a continued westerly flow which does not fully match the polar cell concept.
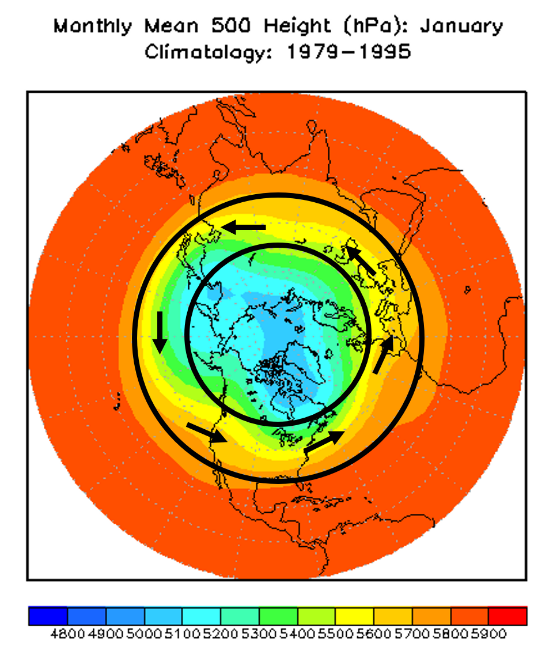
The next figure is a 500 mb average height field for January. This figure is similar to the July one. The height gradient in the midlatitudes between 30oN and 60oN is stronger which in turn makes the wind stronger in winter. Everything else is like the July analysis.
So far, we have examined monthly average analyses. How does a snapshot of a 500 mb chart for one day fit the three-cell model?
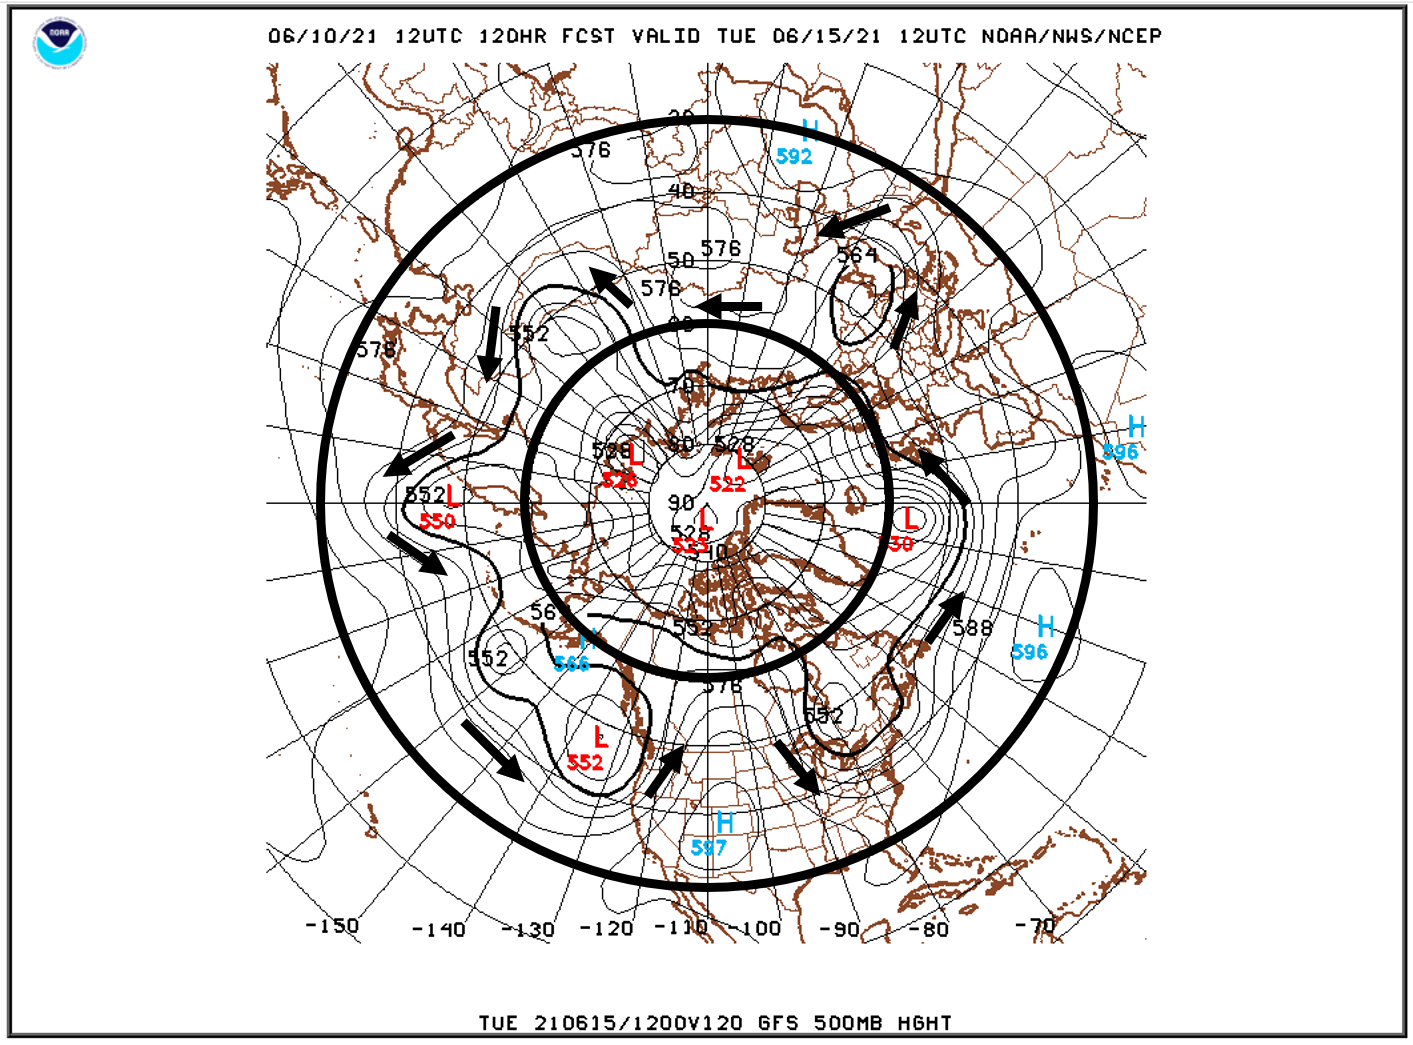
This next map is a 500 mb height chart for June 10, 2021. The black circles again highlight 30oN and 60oN. The height field is the thinner black lines rather than colors. Winds are still parallel to the height contours. From the equator to 30oN, light winds are present since few height lines are present. This observation agrees with the monthly mean charts previously. In the midlatitudes, between the circles, the westerlies and zonal flow are not present. Arrows indicate the wind directions. Significant meridional flow is seen, which does not fit the three-cell model. However, an underlying objective in learning about global circulations is to understand how weather equalizes the temperature differences between the poles and the equator. Meridional flow is needed to accomplish this heat transfer. Zonal flow can transfer heat east or west, but not north and south. These troughs (lower pressure) and ridges (higher pressure) in the midlatitudes will need further investigation because they are important. Lastly, the area around the North Pole has several low-pressure systems which match what was seen on the monthly means.
Overall, the three-cell model coincides with many of the observations for the upper levels, but some discrepancies are still present.
Video: Mod 6.2.5 Three cell model reality check (5:47 min.)
This video examines surface pressure and 500 mb charts to evaluate the three-cell model concept for accuracy.
