5.5 Floods
Module 5.5
Floods
A flood is the flow of water onto land adjacent to a river, stream, lake or ocean not normally covered by water. A flood plain is a strip of relatively flat and normally dry land along a river that is covered by water during a flood. All major rivers have a flood plain somewhere along a portion of their channel. The flood plain can visually be seen as a low area next to the river. Many times, flood plains are used for farming, since the land is very fertile in a flood plain. If a flood occurs, crops will be lost but can be regrown which is easier than replacing flooded structures.
Two conditions are responsible for many floods. These conditions are (1) saturated soils and (2) excessive precipitation. The saturated soils are associated with increased surface runoff, because water cannot infiltrate into the ground. The excessive precipitation is essentially an abundance of water in the basin.
When flooding is forecast to occur or is occurring, three questions arise from those impacted:
- How deep will the water get?
- What areas will be flooded?
- When will the flood crest or crests arrive?
Historical information on past floods associated with a river are essential to answering these questions. River gages, rating tables, and hydrographs provide a portion of this historical information. Another critical piece of information are high water marks. After a flood, hydrologists often visit streams to check for high-water marks. If, for example, records show that the stage reached 17 feet during a storm, a high-water mark will show the hydrologist what was affected by that amount of water. High water marks can be used to estimate how much land alongside a stream will be inundated at various stream levels. These facts are valuable in developing maps showing the impact of floods on the adjacent landscape, structures, and people. This photo is an example of a high water mark.

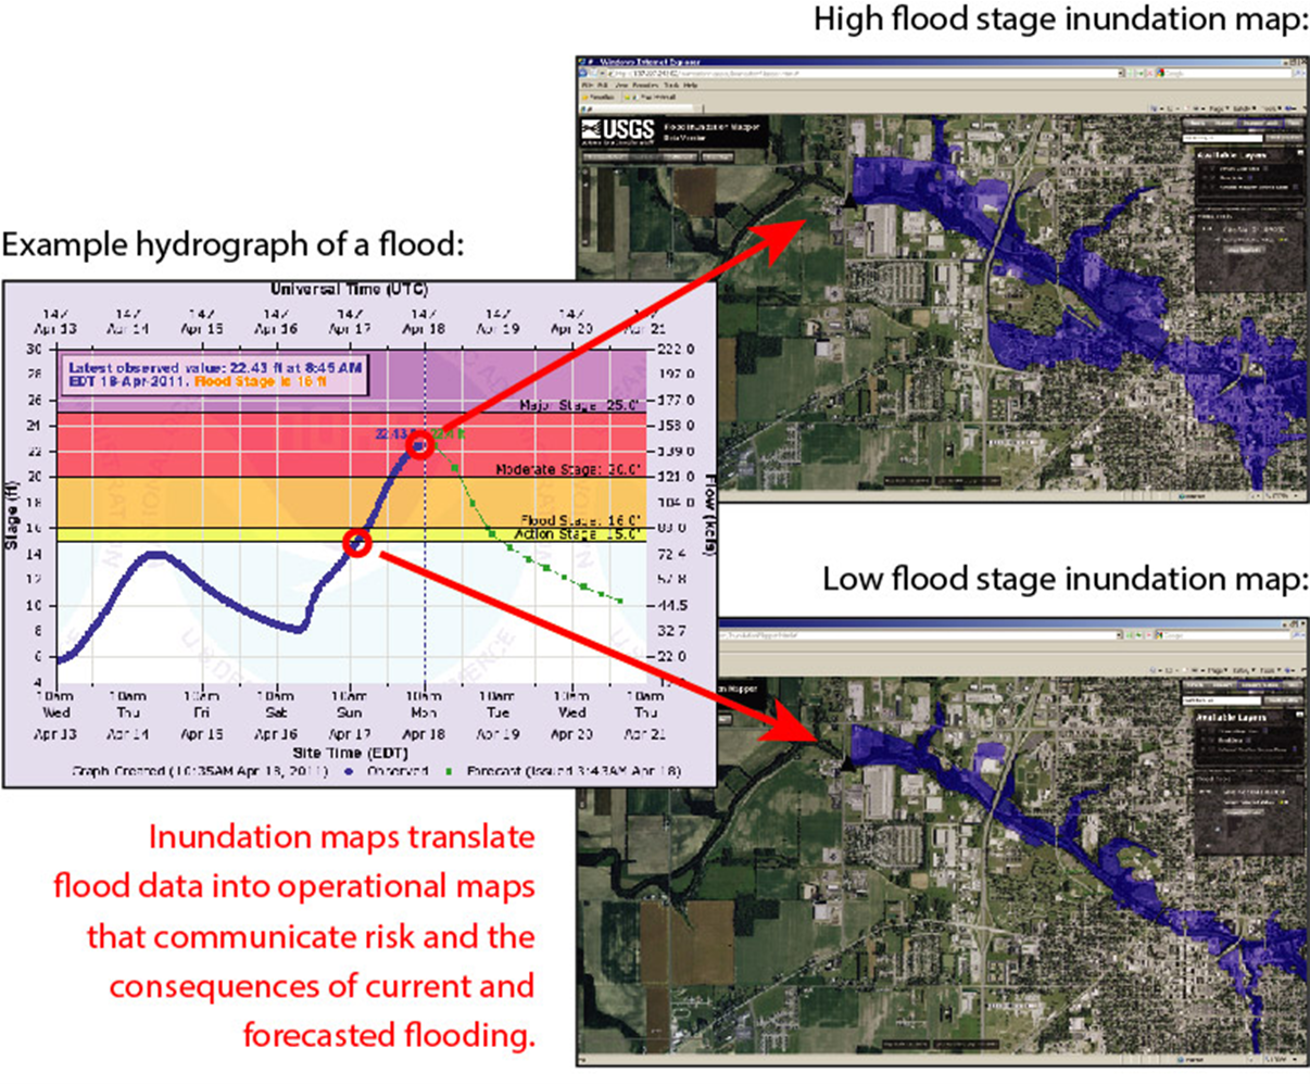
Maps designating areas which will be flooded at various river stage heights are called inundation maps. The figure below illustrates an inundation map and the areas affected by the flood are highlighted in blue. The hydrograph on the left has both observed and forecast data. As the stage height rises, larger areas near the river are flooded.
Inundation maps take time and abundant data to develop. Many communities partner with government agencies to create these maps. However most rivers do not have them. For this reason, a statistical approach is used to define the flood magnitude as a frequency of occurrence. Trying to place a context associated with a flood is where terms such as a “100-year flood” came into being. A 100-year flood is a flood that has a 1% chance of happening every year. Another way to state a flood frequency is a 100-year flood has a 1 in 100 chance of happening every year.
Statistical techniques, through a process called frequency analysis, are used to estimate these recurrence intervals. Recurrence intervals can be calculated for any type of event, such as rainfall over a certain amount, or snow accumulation, and of course flood intervals. Calculating a recurrence interval is the topic of the next section.
Module 5.5.1 Recurrence Intervals
You may never have heard of “recurrence interval”, but the terminology associated with it may still be familiar to you. When a major flood occurs, terms like “the river reached the 100-year flood level” are used. This term means that a flood of that magnitude has a 1 in 100 chance of occurring in any year or a 1% chance of occurring every year.
Two pieces of information are needed to calculate a recurrence interval:
- The number of years that records were taken (N).
- The number of flows above a certain level that occurred during this period of time (M).
A recurrence interval (RI) tells a person the number of years between when a flow of a certain magnitude is expected to occur.
N is found by taking the last year of records and subtracting the first year of records. M is found by listing the highest annual peak flows from the highest to the lowest one. The highest annual peak flow is labeled “1”, the second highest is labeled “2”, and so on down to the lowest annual peak flow. Plug these numbers into the equation to get RI.
The plus one (+1) is needed because when the last year of observations is subtracted from the first year of observations, a year is lost. For example, if we have ten years of records (1, 2, 3, 4, 5, 6, 7, 8, 9, 10) subtracting the last year from the first year (10 – 1) only gives us 9 years. However, we actually have 10 years of data which is 9 + 1 or N + 1.
The equation to calculate a recurrence interval is:

Streamflow recurrence intervals are based solely on the magnitude of the annual peak flow or the highest flow occurring on a river in one year. Ten or more years of data are required to perform this type of frequency analysis. More confidence can be placed in the results of an analysis that has more years of data. A recurrence interval analysis with 100 years of data is much, much better than one with only 10 years of data.
The probability that a flood will occur is given by this equation:

Will a 10-year flood occur once every 10 years? The answer to this question is “no”. On average a 10-year flood will occur once every 10 years, but the floods are rarely spaced exactly 10 years apart. This graph shows the incidence of the 10-year flood for the Embarras River at Ste. Marie, IL. The magnitude of the 10-year flood was determined through a recurrence interval analysis to be about 31,100 cubic feet per second (cfs). The variability in time between “10-year floods” ranges from 4 to 28 years. The average of these intervals is about 10 years. This graph highlights the irregularity of a 10 year flood.
The use of such terms as the “100-year flood” can confuse or unintentionally mislead those unfamiliar with recurrence intervals. Because of the potential confusion, many government agencies are encouraging the use of the annual exceedance probability (AEP) terminology instead of the recurrence interval terminology. For example, one would discuss the “1-percent AEP flood” as opposed to the “100-year flood.”
The criteria associated with a 100-year flood can change as the characteristics of the basin and river channel change. Basin and channel changes that affect flood magnitudes are discussed in the next section.
Module 5.5.2 Basin Changes Affecting Floods
Drainage basins and rivers are in a constant state of change, and the data associated with a river system needs to be constantly updated for accuracy. Common changes that affect flooding or annual exceedance probabilities are:
- Additional river flow data becomes available.
- Installation of flood controls like a dam or reservoir.
- Urbanization of the drainage basin.
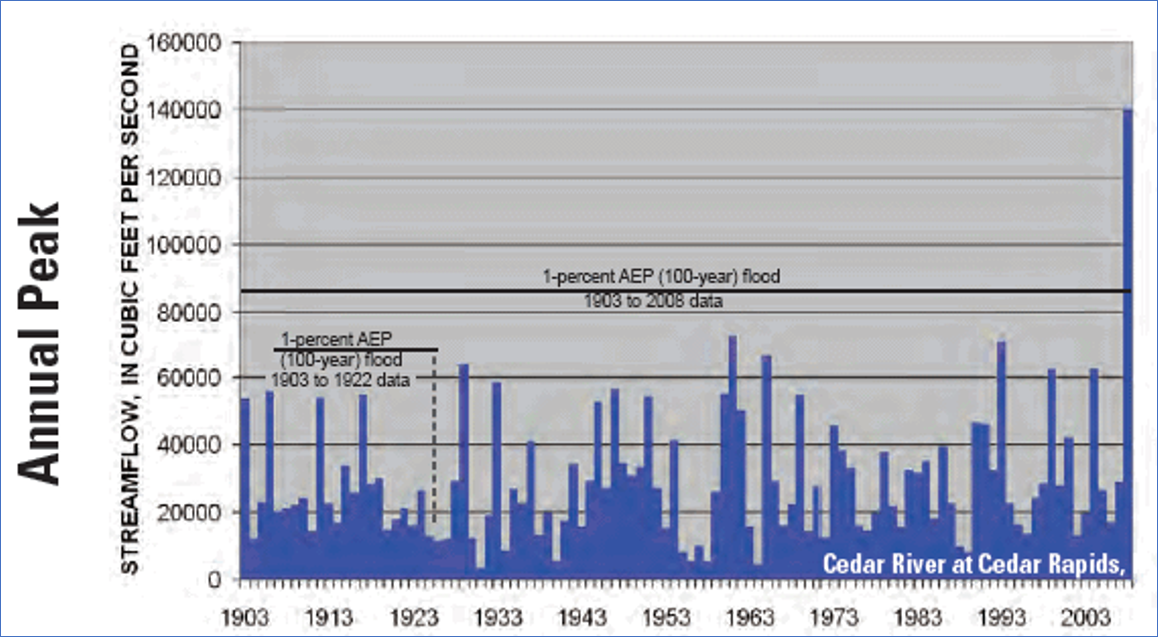
Every year new stage data becomes available for a river. As mentioned previously, a longer data set is much better than a shorter one. Over many years, this larger data set will allow better statistical analysis calculations. This peak annual streamflow graph shows the first 20 years (1903 to 1922) of data has a 100-year flood of about 70,000 cfs. Enlarging this data set to over 100 years (1903 to 2008) indicates a 100-year flood is now closer to 85,000 cfs. The one flood in 2008 with 140,000 cfs significantly changed the statistical analysis.
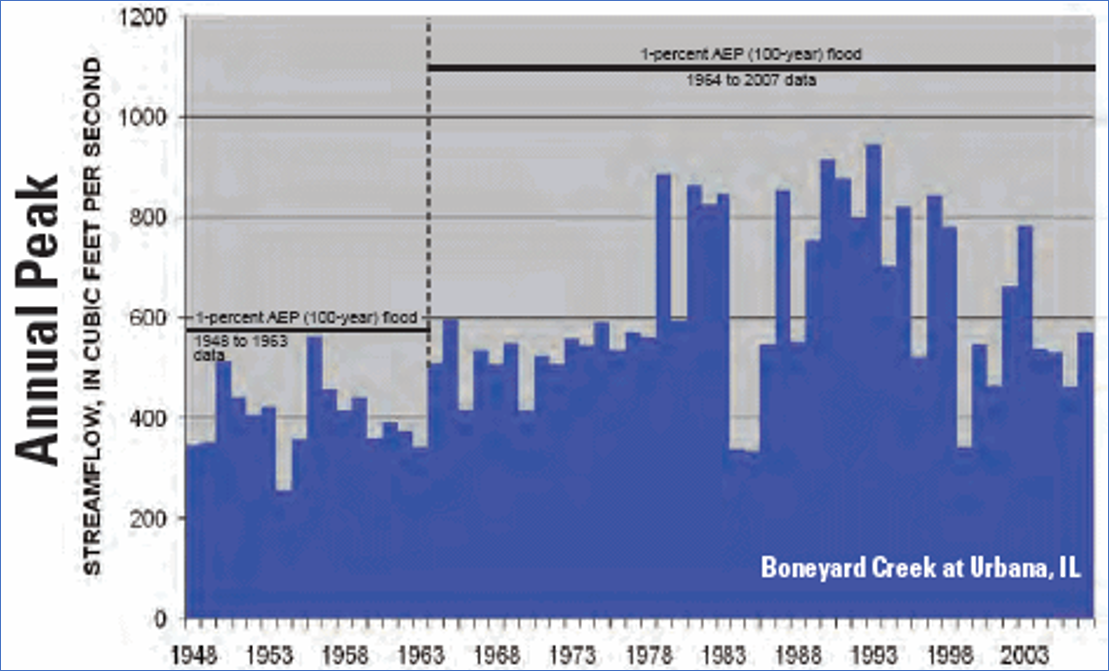
Urbanization of a river basin increases the amount of impervious surfaces present. Impervious surfaces like roads, parking lots and buildings causes surface runoff to occur faster and to increase in volume. A hydrograph will depict urbanization changes by (1) shortening the time between when precipitation fell and the flow crested in the river, and (2) increasing the height of the crest. Both of these changes occur because precipitation infiltration is inhibited. This next graph shows the effects of urbanization on a 100-year flood. The urbanization of Urbana, Illinois (near Chicago) almost doubled the magnitude of a 100-year flood since the 1960s.
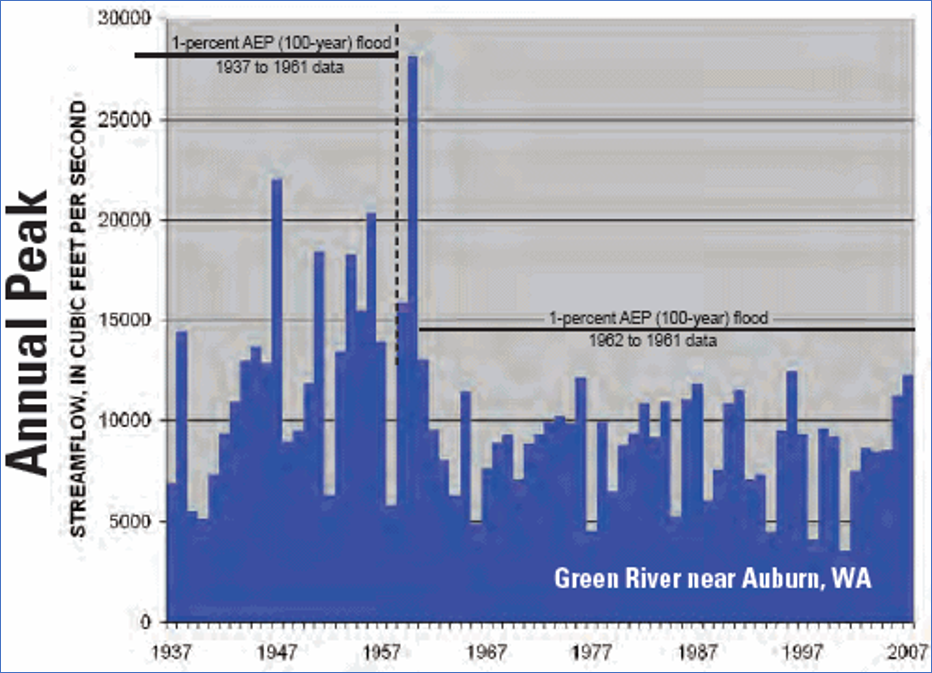
The implementation of flood control structures, such as dams or reservoirs, significantly changes the flood characteristics of a river system. When flood waters flow downstream and enter a dam, the flood essentially stops. This aspect of flood control must be considered when managing the amount of water in a dam. These structures frequently serve as both flood control and sources of water supply for cities or agriculture irrigation. The flood control aspects would like the dam empty when flood waters arrive. The water supply aspects would always like the dam full. Hence, water managers must consider these competing priorities when storing or releasing water. This next annual peak streamflow graph shows how the building of a dam in the 1960s reduced the magnitude of a 100-year flood from 28,000 cfs to less than 15,000 cfs.
References:
Illustrations, photo and portions of the text are from the USGS and are found at https://www.usgs.gov/special-topic/water-science-school/science/floods-and-recurrence-intervals?qt-science_center_objects=0#qt-science_center_objects
https://www.usgs.gov/special-topic/water-science-school/science/high-water-marks-and-flooding?qt-science_center_objects=0#qt-science_center_objects
Portions of the text are from the USGS and are found at https://www.usgs.gov/special-topic/water-science-school/science/floods-things-know?qt-science_center_objects=0#qt-science_center_objects
