5.3 Water (Hydrologic) Cycle
Water (Hydrologic) Cycle
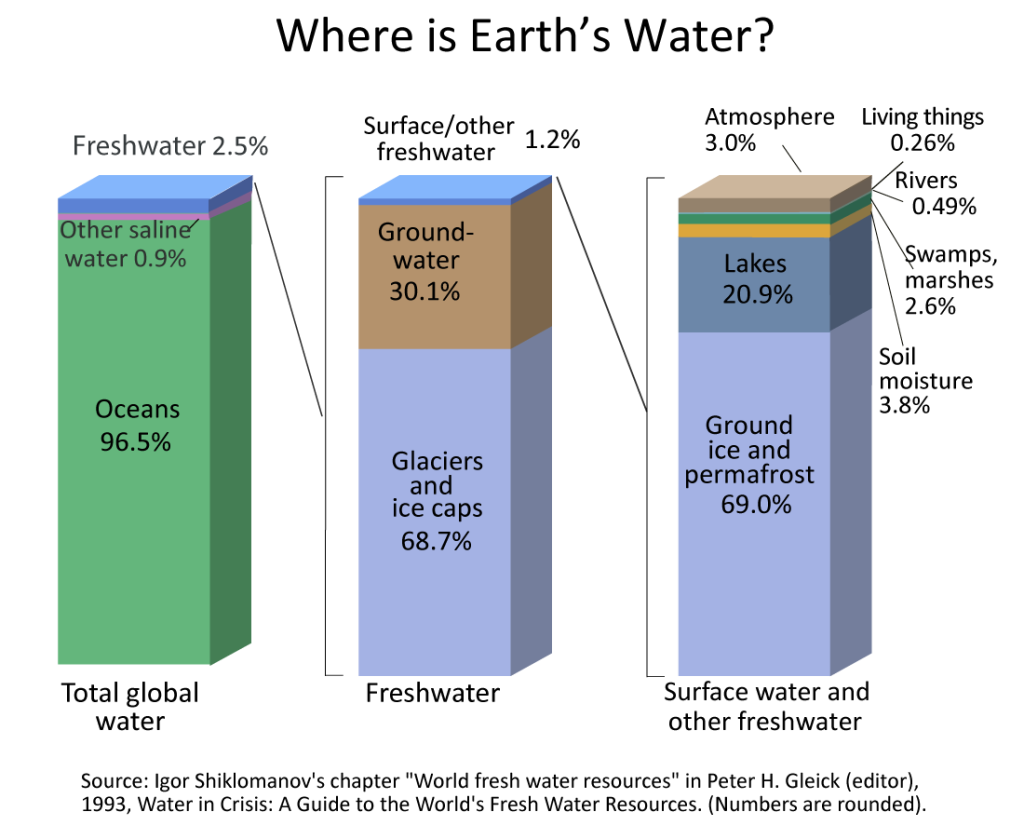
In past classes you have likely learned about the water cycle. Now that we understand how precipitation occurs, we are going to examine this cycle from a global perspective. Most of the Earth’s surface (about 70%) is covered with water. Most of this water (about 97%) contains salt and is in the oceans. This amount leaves about 3% of Earth’s water as fresh water (without salt). Slightly less than 69% of this fresh water is frozen in glaciers and the polar ice caps. Another 30% is underground which leaves about 1% of this fresh water above the surface in the atmosphere, lakes, rivers and ice on the ground. The percent of total water in the Earth’s atmosphere is about 0.001%. Only a small percentage compared to the total amount of water on the Earth.
Hydrology is the science of water and its global circulation, distribution, and properties. Hence, the water cycle is also frequently referred to as the hydrologic cycle. This next figure illustrates important aspects of the water cycle.
Nearly 86% of evaporation originates from the oceans. The remaining 14% originates from the land through transpiration from plants and evaporation from the soil. Plants evaporate water to maintain their temperature which is called transpiration.
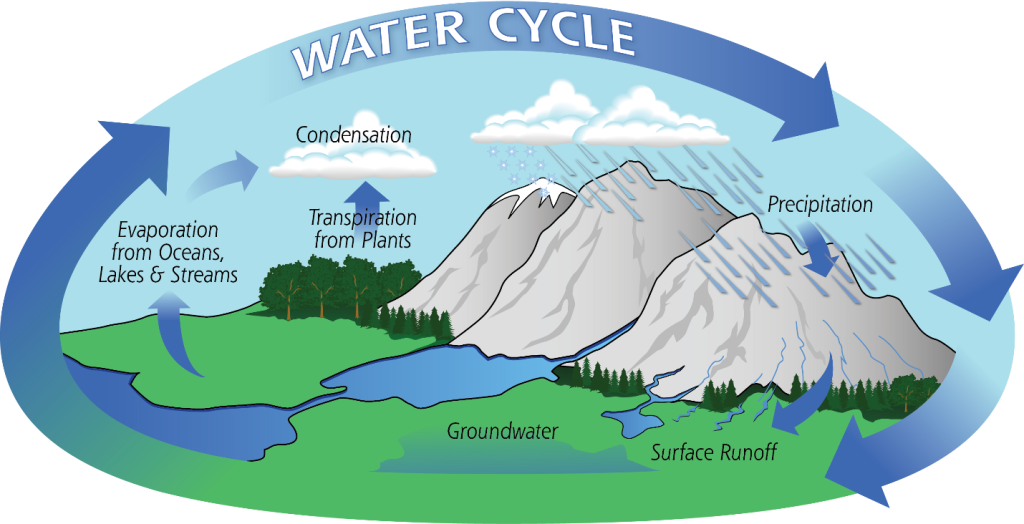
Since the oceans cover most of our planet, 78% of global precipitation occurs over the oceans. This leaves 22% of the remaining precipitation occurring over land. Since evaporation from land and plants is 14%, only 8% of the Earth’s total precipitation goes into groundwater and surface runoff. Our main interest from an atmospheric perspective is surface runoff, because we would like to know how excess precipitation creates a flood. In this submodule, we will examine ground water and surface runoff. Subsequent submodules will look at measuring surface runoff and any flooding that may occur.
Module 5.3.1
Ground Water
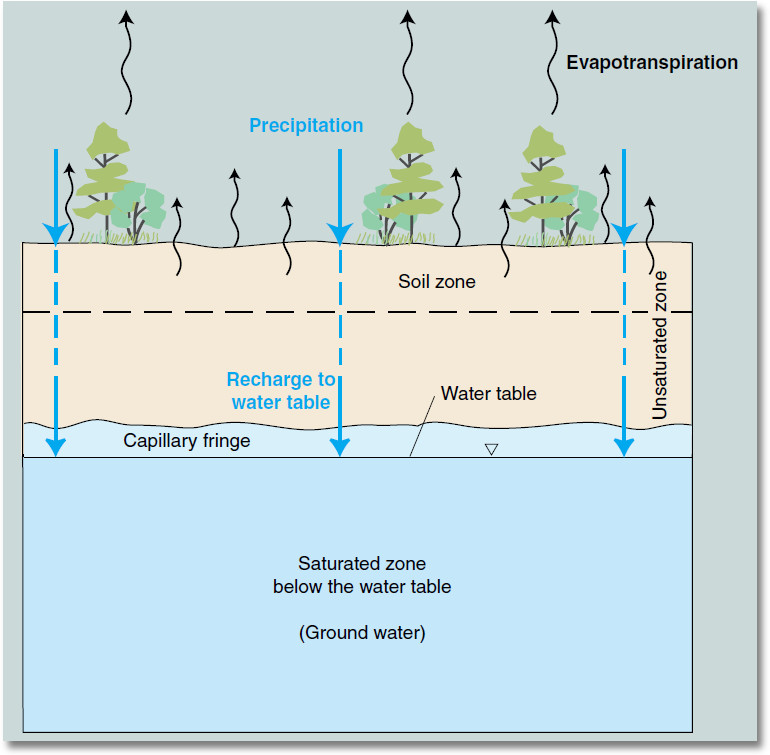
Precipitation can either become groundwater, surface runoff or evaporate. This section focuses on groundwater. Groundwater begins when precipitation infiltrates through the soil to a saturated zone. The water table is the top of this saturated zone beneath the Earth’s surface.
The upper layer of the soil is the unsaturated zone, where water is present in varying amounts but does not saturate the soil. Below this layer is the saturated zone, where all of the pores, cracks, and spaces between soil particles are filled with water. The term groundwater is used to describe this area. Another term for groundwater is aquifer. However, the term aquifer is usually used to describe formations capable of yielding enough water to supply a population. Aquifers are a huge storehouse of Earth’s water, which many people depend on in their daily lives. Precipitation and infiltration replenish an aquifer.
If the aquifer is permeable enough to allow water to move through it, then water can be withdrawn from it through wells. The level of the water table changes naturally over time due to changes in precipitation patterns, streamflow and geologic changes, and even human-induced changes.
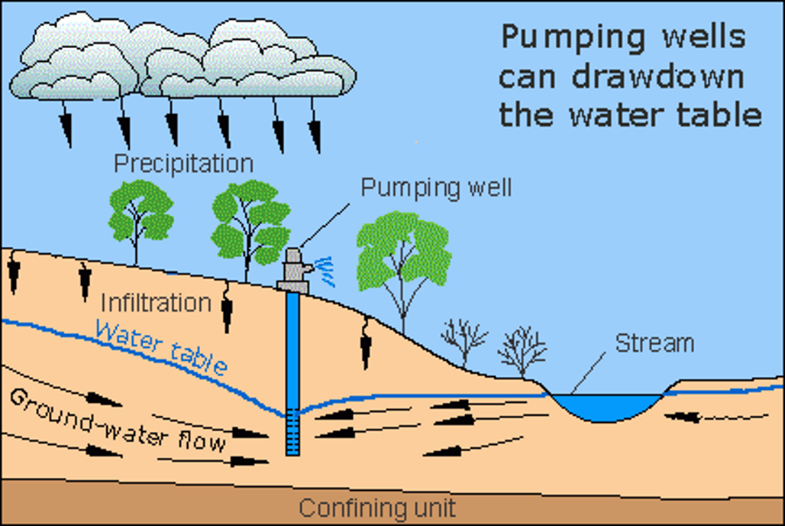
The pumping of wells can have a big influence on water levels below ground, especially in the vicinity of the well, as this next diagram shows. Depending on geologic and hydrologic conditions of the aquifer, the impact on the level of the water table can be short-lived or last for decades. Excessive pumping can lower the water table so much that the wells and nearby streams go dry.
“Base flow” is the sustained flow of a stream in the absence of precipitation. A natural base flow is maintained largely by groundwater. Notice in the illustration on the right that the water table intersects with the top of the stream level. If the pumping well were to continue to lower the water table, the water in the stream would eventually disappear.
This picture from the San Joaquin Valley, an agricultural area in California, indicates the extent of land subsidence in this aquifer. Years and years of pumping groundwater for irrigation has caused the land to drop. The top sign shows where the land surface was in 1925 compared to 1977 when the picture was taken.
Module 5.3.2
Surface Water
When rain occurs, the water can either (1) infiltrate into the soil, (2) evaporate, or (3) flow downhill overland. Overland flow occurs when rain falls on saturated soils or the ground is impervious to infiltration (like an asphalt street). Water always flows downhill under the force of gravity into smaller tributaries, rivers and then usually into a sea or ocean. This information graphic explains the various components of a river.
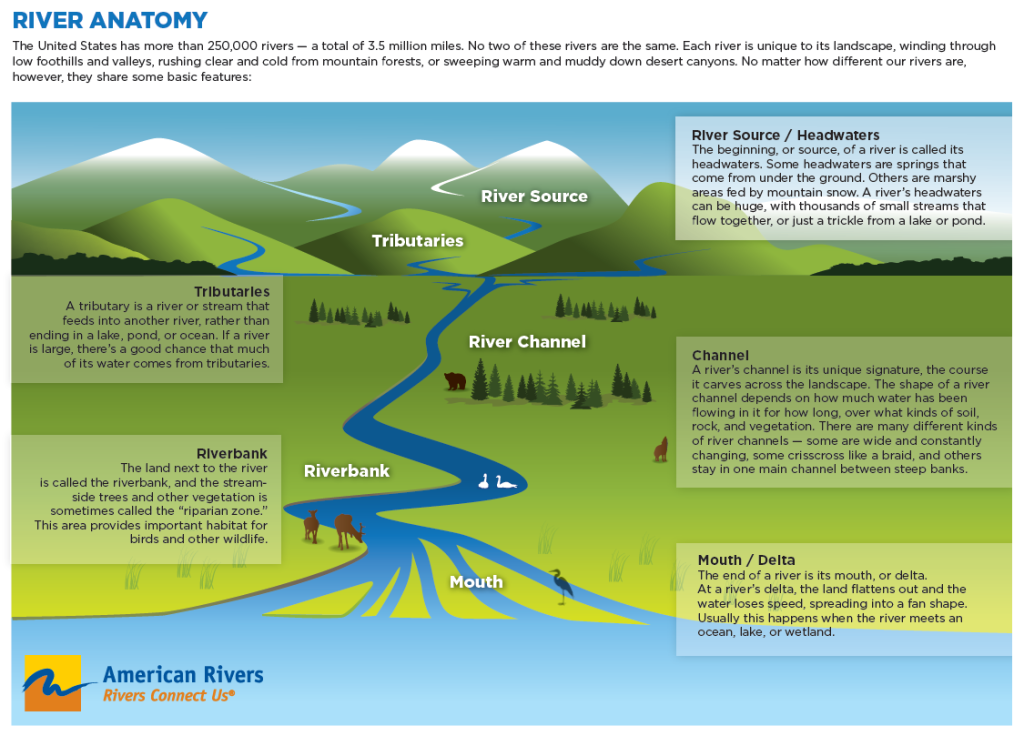
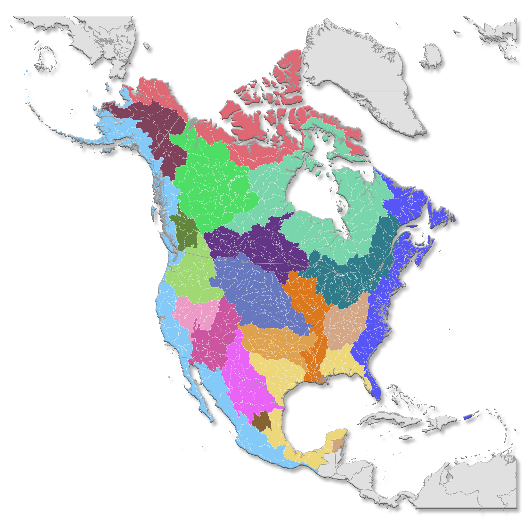
A drainage basin or watershed is an area of land that drains all the streams and rainfall to a common outlet. Drainage basins can be as small as a canyon or as large as a portion of a continent. This map shows the larger watersheds in North America. The top or highest portion of a basin where surface flow first originates is called its headwater. The end or lowest portion of river when it empties into a larger body of water is called the river’s mouth or delta.
Arizona resides in the Colorado River Basin, which encompasses about 246,000 square miles and drains into the Pacific Ocean. The Colorado River, like most rivers in the western United States, is regulated by dams. Dams provide numerous resources to the area such as irrigation water, hydroelectric power, safety from floods and drought, and recreation. All the dams are labeled in purple on this map.


Within Arizona are 14 smaller basins that reside in the Colorado River Basin. Tucson resides in the Santa Cruz River Basin which flows from Mexico north to where it joins with the Gila River. The Gila River is another major river in southeastern Arizona. The Gila River has its headwaters in the Gila Mountains of New Mexico, and the White Mountains which reside along the New Mexico and Arizona border.
Each of the red triangles on this map represents a river gage that measures the amount of water flowing in the river channel. The blue lines on this map represent tributaries that flow into the primary river. Basins are generally named after the largest river in the area. As you can imagine, a finer scale basin map will depict smaller and smaller basins. Gages are placed to monitor tributaries, and at key locations on the main river to track water as it flows downstream. Measuring flow in these rivers is the topic of the next submodule.
Video: Groundwater, Surface Water and Drainage Basins (6:35 min)
This video examines the important aspects of groundwater, surface water and drainage basins.
