5.2 Growth of Cloud Droplets for Precipitation
We have a lot of knowledge about saturation, condensation and the types of clouds which can form by these processes. However, we have not examined the processes necessary for precipitation to occur. This submodule looks at how precipitation happens.
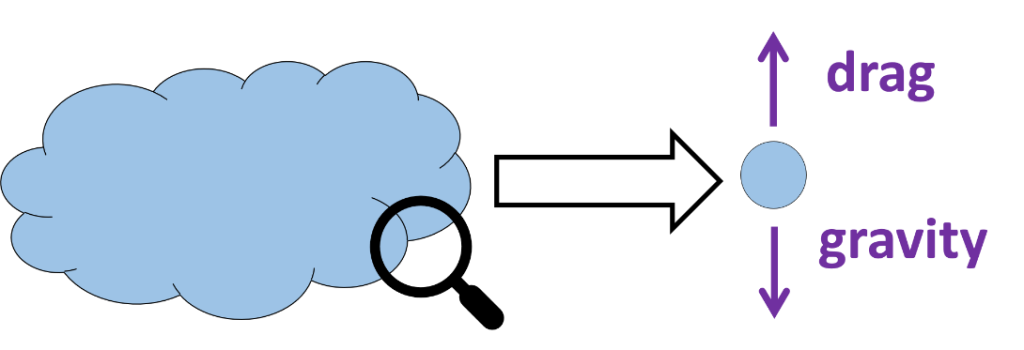
Condensation can create water droplets, but how do these droplets fall out of the cloud to the Earth as precipitation. When examining cloud droplets, two forces are acting on a droplet (1) drag and (2) gravity.
Gravity is pulling the droplet towards the Earth. Drag can be thought of as the resistance resulting from the droplet needing to move air molecules out of the way to descend. Cloud droplets remain suspended when gravity cannot overcome this opposing air resistance. If gravity cannot overcome drag the droplet remains suspended.

If gravity can overcome drag the droplet begins falling. The speed of this descending droplet is called its terminal velocity. The terminal velocity of a 100µm droplet is about 1 meter per second or 2.2 mph. As a droplet falls it must still contend with condensation and evaporation rates. Many times, droplets falling out of a cloud will evaporate before reaching the surface. Precipitation evaporating before reaching the ground is called virga. This photo has virga occurring.

5.2.1 Size Differences Between Cloud and Rain Droplets
A cloud is a visible suspension of water droplets. Knowing the droplet sizes would be helpful in investigating how precipitation forms. This diagram illustrates the various sizes, from the cloud condensation nuclei up to a small rain drop. A drizzle drop is a very small droplet that appears to “float” as it slowly descends to the surface.
Note the wide range in size, volume, and number of particles in the figure to the right. “D” is the diameter of the drop, “n” is the typical number found per cubic centimeter (cm-3) or liter (L-1) of air. The smallest, the cloud condensation nuclei (CCN), is a particle to which water can attach itself (called hydrophilic). These particles grow by adding water molecules, but still contain the original CCN upon which they formed. As the figure illustrates, a small raindrop is huge compared to a cloud water droplet.

An important piece of information we need to know is how large can a raindrop grow through condensation? This graph answers that question.

Interpreting this graph, we see that the cloud drop radius increases rapidly through condensation at the beginning, but slows down within minutes. A cloud drop can grow to about 20 µm in 15 minutes. After 15 minutes growth is much slower. Since the lifetime of a cloud drop is in the tens of minute range, it is not possible for cloud drops to grow into rain drops by condensation alone. Some other processes must be occurring to generate precipitation. To examine these other processes, we are going to categorize them by temperature. The warm cloud process occurs in clouds above freezing or warmer than 0℃. The cold cloud process occurs in clouds where a portion or the entire cloud is below freezing or less than 0℃.
5.2.3 Cold Cloud Ice Growth Process
When a portion of a cloud is below freezing (0℃) ice crystals and supercooled water are present in the cloud. Ice crystals add a new perspective in growing particles fast enough to gain a terminal velocity for reaching the ground.
The basis for this ice process of precipitation is that saturation vapor pressure with respect to ice is less than with respect to liquid water at the same temperature. The graph to the right illustrates this condition.
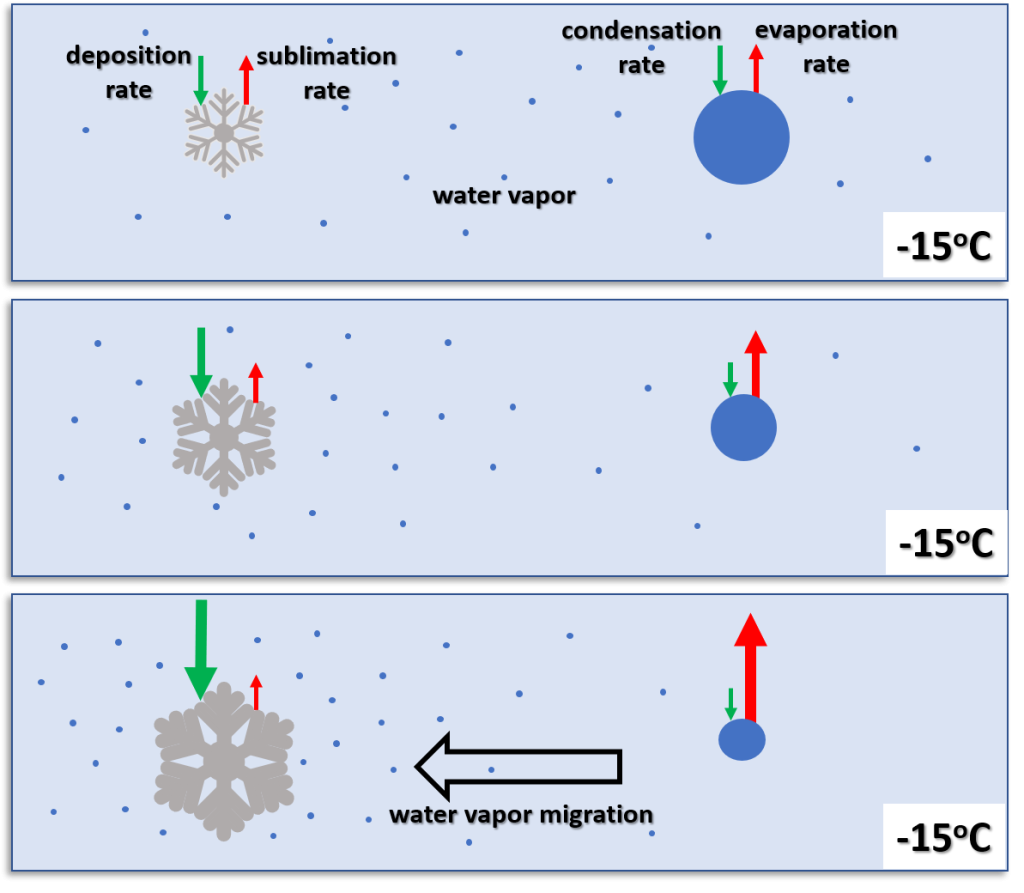
Okay, that is a nice graph but why is this important? The physical meaning of this graph is that when ice crystals and supercooled water droplets are competing for water vapor to grow, the ice crystals will always win. Ice crystals will grow at the expense of the water droplets. The pressure gradient force is valid in a saturated water vapor environment, and the vapor will travel from a higher to a lower pressure. Ice has the lower pressure (blue line) and will always win in a growth contest with liquid water. The next diagram illustrates this ice process in action.


The mixed states of ice, liquid water and water vapor are present in many clouds. The best example of a mixed state cloud is the cumulonimbus or a thunderstorm. Between 0℃ to -40℃ a mixture of ice and supercooled liquid droplets and water vapor is present. When the precipitation falls into temperatures above freezing everything melts. While liquid water will not instantly freeze at temperatures colder than freezing, ice does melt quickly in the atmosphere when temperatures are above freezing. This figure depicts the states or phases of water in a thunderstorm. Everything colder than -40℃ is ice. Everything warmer than 0℃ is water or melting ice soon to be liquid.

The ice process of precipitation is also referred to as the Bergeron-Findeisen-Wegener process. T. Bergeron, W. Findeisen and A. Wegener were the researchers working on this theory in the first half of the 1900s. In this course, we will refer to it as the ice process of precipitation or just ice process for simplicity.
Video: Demonstration of the Bergeron-Findeisen Process (7:24 min)
This video demonstrates the ice process of precipitation in a cloud chamber. The video starts with a chamber of liquid water droplets (about 20-30 µm in diameter) and cools them to -15℃. The droplets remain liquid and are thus supercooled. An ice crystal is introduced into the chamber which rapidly freezes all the supercooled droplets. The ice crystals sparkle as light reflects off of them. This video is best viewed in HD, and only the first 2-3 minutes needs to be viewed to see the ice process of precipitation in action.
5.2.4 Cold Cloud Riming and Aggregation
As in the liquid water environment (collision-coalescence), collisions between ice crystals and water droplets can occur in a supercooled environment. Riming is when water droplets collide with ice and freeze. Riming is also called accretion. Aggregation is when ice crystals collide and stick together. Most snow falling to the ground is a collection of ice crystals formed through aggregation and riming. This diagram depicts all of these collisions that can occur to increase the size of a droplet or ice crystal.

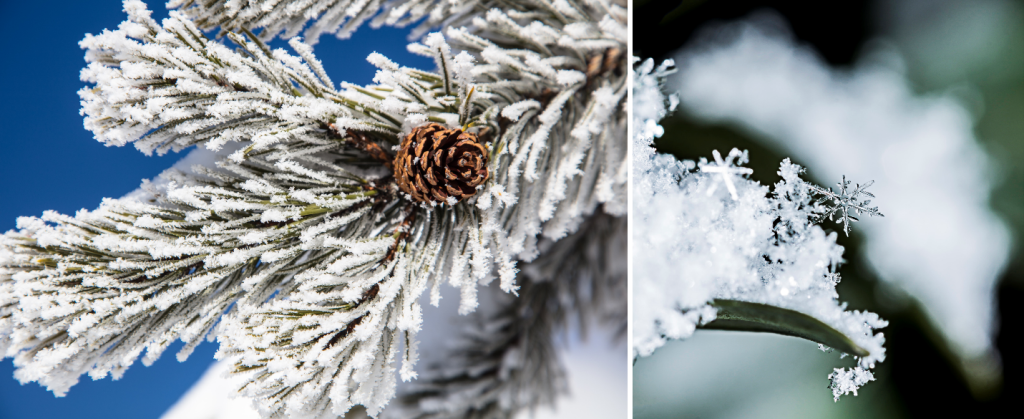
Rime ice is a common occurrence in mountain locations. The supercooled water droplets in the cloud come in contact with cold objects on the ground and freeze. This picture from Yellowstone National Park shows rime ice on a tree. Riming is most efficient between the temperatures of 0℃ to -10℃. This picture of snow shows an example of aggregation. Additionally, some of the snow crystals in this picture appear to exhibit the effects of riming. All of these types of collisions can occur simultaneously and are not mutually exclusive. Aggregation is most efficient with temperatures near 0oC. The liquid water on the outside of ice crystals near-freezing increases the bonding when they collide.

Video: Cold Cloud Ice Growth Process (5:27 min)
This video discusses the important aspects of the ice process of precipitation along with aggregation and riming.

