4.4 Lowering Air Temperature
Concepts for Lowering the Air Temperature
As mentioned previously, the most common method for saturation to occur in the atmosphere is cooling the air until the dew point temperature is reached. These methods involve heat and must follow the Laws of Thermodynamics. Hence, this submodule looks at these processes from a thermodynamic aspect. We will then examine common mechanisms in the atmosphere that cause cooling and air saturation.
4.4.1 Diabatic Versus Adiabatic Processes
When looking at cloud formation, air temperature changes can be divided into two categories (1) diabatic (pronounced die-uh-ba-tic) and (2) adiabatic (pronounced ay-dee-uh-ba-tic) processes.
A diabatic process involves the exchange of energy with its surroundings. An adiabatic process occurs without the exchange of energy. Energy, in these sentences, is generally referring to a heat or temperature difference between the process and its surroundings. Both of these processes occur in the atmosphere. An example of a diabatic process is the Sun shining on the Earth to heat its surface. This surface heat is transferred to the atmosphere through a diabatic process. The Earth’s surface and the atmosphere have an exchange of heat energy.
An adiabatic process has no exchange of heat with its environment. Any changes in the system are internal and solely a consequence of work. An example of an adiabatic process is seen when applying the Ideal Gas Law. When compressing air with a bicycle pump, its pressure increases. This increase in pressure results in a corresponding temperature increase. Hence, a bicycle pump is an example of an adiabatic process, no heat has been added from an outside source.
In the atmosphere, an adiabatic process is used to understand parcels of air. Air parcels can be thought of as a balloon containing a sample of the atmosphere. This parcel can move up and down in the atmosphere. The pressure and temperature inside the parcel may change depending on its altitude. The parcel size may expand or contract. However, no energy exchange is allowed from the outside into the parcel. Any changes to the parcel must come from within itself.
An adiabatic process is an ideal condition for increasing our understanding of atmospheric air motions. The next two sections look at two cases of adiabatic motion, one without condensation and one with condensation.
4.4.2 Dry Adiabatic Lapse Rate (DALR)
As an air parcel moves up and down in the atmosphere, its temperature will change because the pressure surrounding it changes. As the parcel rises, the size of it will increase to match the decrease in “outside” pressure. A decrease in pressure causes a temperature change per the Ideal Gas Law. This change in temperature with altitude is called a lapse rate. The rate at which a rising parcel of unsaturated air cools is called the dry adiabatic lapse rate (DALR). Notice this definition states the parcel is unsaturated, which implies no condensation is occurring. Thus, the DALR occurs without condensation. The dry adiabatic lapse rate in the atmosphere is -1oC / 100m, which means for every 100 meters of ascent the temperature cools 1oC.

Video: Mod 4.4.2 Dry adiabatic lapse rate (3:32 min.)
This video discusses the diabatic versus adiabatic processes and the dry adiabatic lapse rate.
4.4.3 Moist Adiabatic Lapse Rate (MALR)
Sometimes as air parcels change position in the atmosphere, saturation occurs followed by condensation. Like the dry adiabatic lapse rate, the temperature will decrease as the altitude increases. However, when condensation occurs latent heat is released which warms the parcel. The rate at which a rising parcel of saturated air cools is called the moist adiabatic lapse rate (MALR). The amount of water vapor present determines the exact lapse rate. On average, the moist adiabatic lapse rate in the atmosphere is -0.5oC / 100m. The MALR is half of the DALR due to the latent heat of condensation. The moist adiabatic lapse rate is also called the saturated adiabatic lapse rate or the wet adiabatic lapse rate. All three names are the same. For this course, we will only use the moist adiabatic lapse rate (MALR) to avoid confusion.
As air parcels rise, condensation does not begin immediately. The parcel must rise, cool, reach saturation and then condensation can begin. The altitude at which condensation starts is called the lifting condensation level (LCL). This altitude is when clouds start to form, so the height to the bottom of a cloud is the LCL.
This diagram illustrates the LCL, DALR, and MALR.

Video: Mod 4.4.3 Moist adiabatic lapse rate (2:43 min.)
This video discusses lapse rates and the lifting condensation level in more detail.
4.4.4 Environmental Lapse Rate
When air parcels move vertically in the atmosphere, the temperature of the parcels follows the appropriate lapse rate. The DALR is the appropriate lapse rate when the parcel has no condensation and it is the MALR when condensation is occurring. These lapse rates are important because atmospheric stability is directly related to them when the environmental lapse rate of the atmosphere is known. The environmental lapse rate (ELR) is the actual rate of change of temperature with altitude. The environmental lapse rate is constantly changing and varies at every location.
The environmental lapse rate is obtained through the use of weather balloons and is called an upper air sounding or just sounding. A radiosonde is the weather instrument attached to the weather balloon and released into the atmosphere. The radiosonde measures temperature, dew point, pressure, altitude, and wind while sending this information back to the launch site through a built-in radio transmitter. Weather balloons are launched twice a day (00Z and 12Z) in the United States and most other countries. Tucson is an upper air sounding site with daily launches from the National Weather Service office at the University of Arizona.

Sounding data is the highest quality data available in the atmosphere and is widely shared through international agreements.
Video: Preparing and launching a weather balloon (2:12 min.)
This video shows the details of a weather balloon launch. If you ever wanted to watch a weather balloon launch, now is the time!
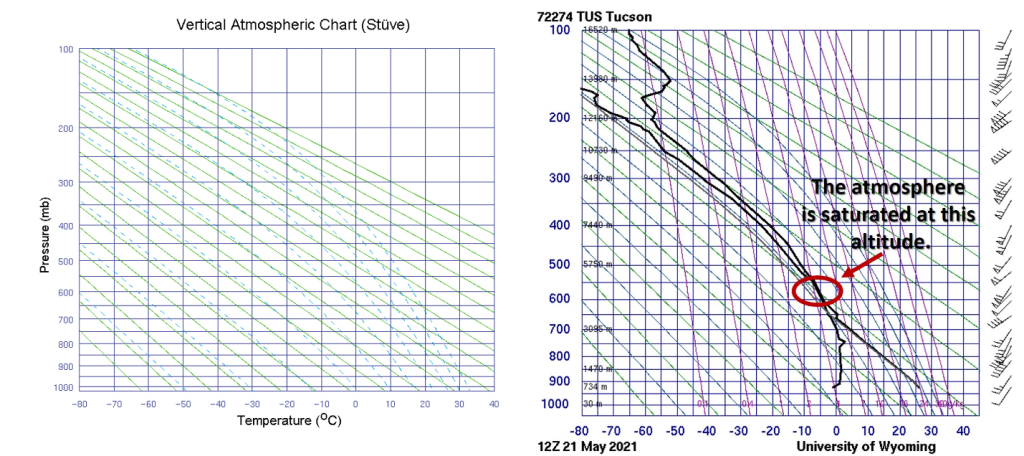
Sounding data is plotted on thermodynamic diagrams, which allow for a quick stability analysis of the atmosphere. Many thermodynamic diagrams exist. The two most widely used are a called a Stüve diagram and Skew-T. The Stüve is the easiest to use and the one we will be using in this class. The Skew-T diagram is almost identical to the Stüve except the temperature lines are skewed (at an angle).
The two most important lines on a Stüve diagram are the vertical temperature lines on the x-axis and the horizontal pressure lines on the y-axis. Unlike many graphs, the y-axis pressure values decrease with height. The temperature and dew point values are plotted in the body of the graph. The wind information is placed on the right side. A typical upper air plot on a Stüve diagram is shown below.

The solid black line on the right is the temperature plot. The solid black line on the left is the dew point plot. Remember the dew point must always be less than the ambient temperature, which is shown in this example. The dew point and ambient temperature are the same value around 550 to 600 mb. This indicates the atmosphere is saturated at this level, and a few light sprinkles of rain were occurring in Tucson on this day.
4.4.5 Four Mechanisms that Lift Air and Cause Cooling
The primary method to achieve saturation in the atmosphere is to cool the air parcel or to lift the air parcel vertically. As the parcel ascends, cooling takes place at a rate similar to either the dry or moist adiabatic lapse rates. The unanswered question now is what lifts these air parcels? There are four mechanisms that can lift air and cause condensation: (1) orographic lifting, (2) convergence at the surface, (3) frontal lifting, and (4) convection due to surface heating.
Orographic lifting occurs when air encounters a mountain and is forced to rise over it.

The windward side of the mountain is cooler and wetter. As the air rises, the pressure decreases causing cooling, saturation, condensation, and frequently some precipitation. On the leeward side, air descends (subsides) to a lower altitude and experiences an increase in pressure. This increase in pressure causes warming. Since moisture in the airflow is removed on the windward side, precipitation is greatly reduced on the leeward side of an orographic barrier. This area of reduced precipitation is called a rain shadow.
A rain shadow is easily seen in the vegetation differences across Washington and Oregon. The coastal and Cascade mountains receive much more precipitation than the interior portions of these states.

The second type of lifting is convergence at the surface generally associated with low pressure. We already know wind moves from high to low pressure, and low pressure at the surface leads to rising air. Therefore, this rising air will cool air parcels and cause saturation and condensation.

The third type of lifting is frontal lifting. Frontal lifting is when colder air slides underneath warmer air or warmer air rises over cooler air. Cooler air is denser than warmer air, so when the air of different densities meets, the denser one is on the bottom. The boundary separating these areas of different temperatures is called a front. We will cover fronts in more detail later in this course.
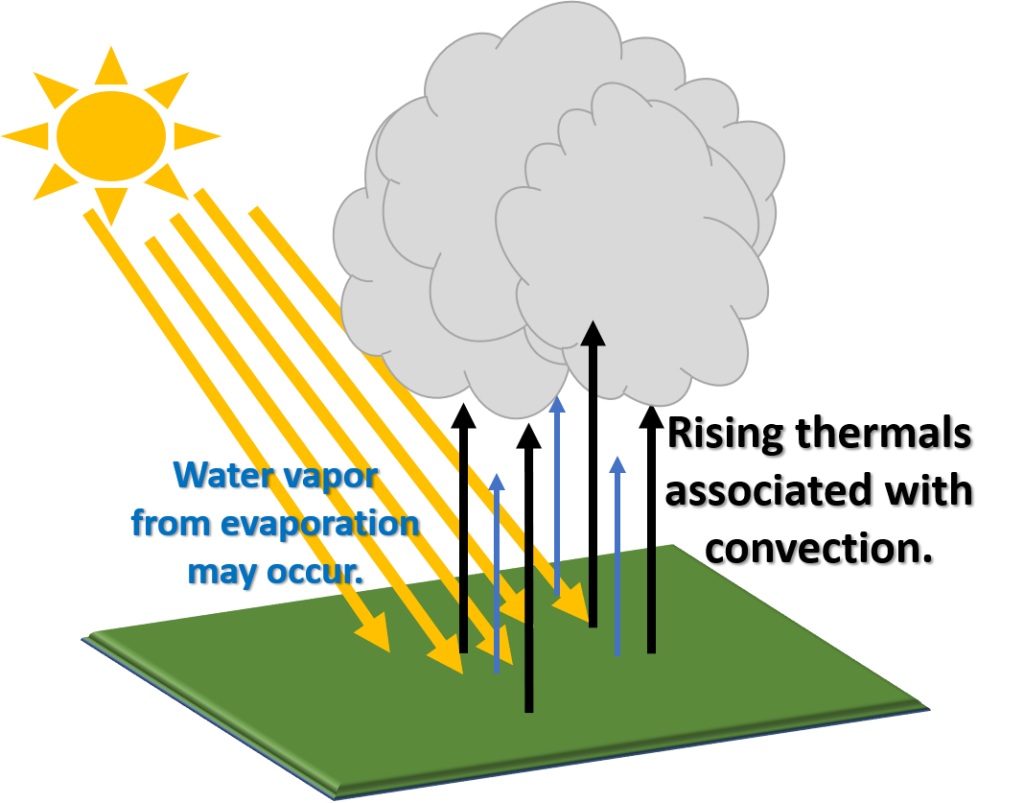
The fourth type of lift is heating of the Earth’s surface leading to convection. As the surface of the Earth warms from sunshine, the air near the surface rises and mixes this heat into the atmosphere. This situation is the same as the convective heat transfer covered in Chapter 2. The warm rising air is called a thermal. Evaporation from soil moisture may also be carried into the atmosphere through convection.

Thermals tend to have an upward-moving area next to a downward area as the air mixes. This pattern generates small clouds evenly spaced apart from each other. This cloud pattern is generally associated with fair weather.

Video: Mod 4.4.5 Four mechanisms that lift air (6:28 min.)
This video covers the lifting mechanisms present in the atmosphere which can lead to saturation, condensation, and possibly precipitation.
References:
world_ua_sites.jpg – Public domain from NOAA, NWS at https://www.weather.gov/jetstream/radiosondes
Stuve example.jpg – Data available from the University of Wyoming at http://weather.uwyo.edu/upperair/sounding.html Annotated to identify the saturated layer.
orographic lift.png – Mount Rainier photo is public domain from Wikimedia Commons at https://commons.wikimedia.org/wiki/File:Mount_Rainier_panorama_3.jpg Modified to illustrate orographic lift and subsidence warming / drying.
rain shadow.png – Terrain and vegetation image in public domain and from NASA MODIS at https://visibleearth.nasa.gov/images/62176/oregon-and-washington. Annotation was added to illustrate the rain shadow.
surface convergence.png – Public domain from NOAA, NWS at https://www.weather.gov/jetstream/wind
density with cloud.jpg – Public domain from NOAA, NWS at https://www.weather.gov/jetstream/parcels Modified to add a cloud over the rising air.
cumulus_L1_1.jpg – Public domain from NOAA. Obtained from COMET.

