3.2 Concepts Associated with Pressure
3.2 Concepts Associated with Pressure
In Chapter 1, the concept of air pressure was introduced. Air pressure is a critical aspect of weather, because differences in pressure cause the wind. Wind can lead to storms, dramatic temperature changes and much more. Obviously, we need to know much more about pressure to understand weather. This submodule and the next provide those details.
3.2.1 Measuring Pressure
Air pressure is the weight of an air column that extends from the ground to the top of the atmosphere. This statement is from Chapter 1 and defines surface pressure. Surface pressure is the measure of air pressure at the surface.
As elevation increases, the mass of the atmosphere above a location on the surface decreases. Air pressure on a high mountain will always be less than in a valley. Pressure is a unique atmospheric parameter in that it always decreases vertically.
The pressure at P1 will be the weight of the air above the mountain. The pressure at P2 will be the pressure at P1 plus the weight of the air between P1 and P2. This aspect of pressure presents a problem, because we would like to compare the surface pressure at every location. Every location has a different elevation, so comparing surface pressures will not work. A new definition will fix this surface pressure conundrum. Sea-level pressure is the surface pressure of a location as if that location were at sea-level. Taking the surface pressure and converting it to sea-level allows a person to compare pressures at all locations without regard to elevation. These comparisons will increase our understanding of the air motion associated with changes in weather. Hurray!
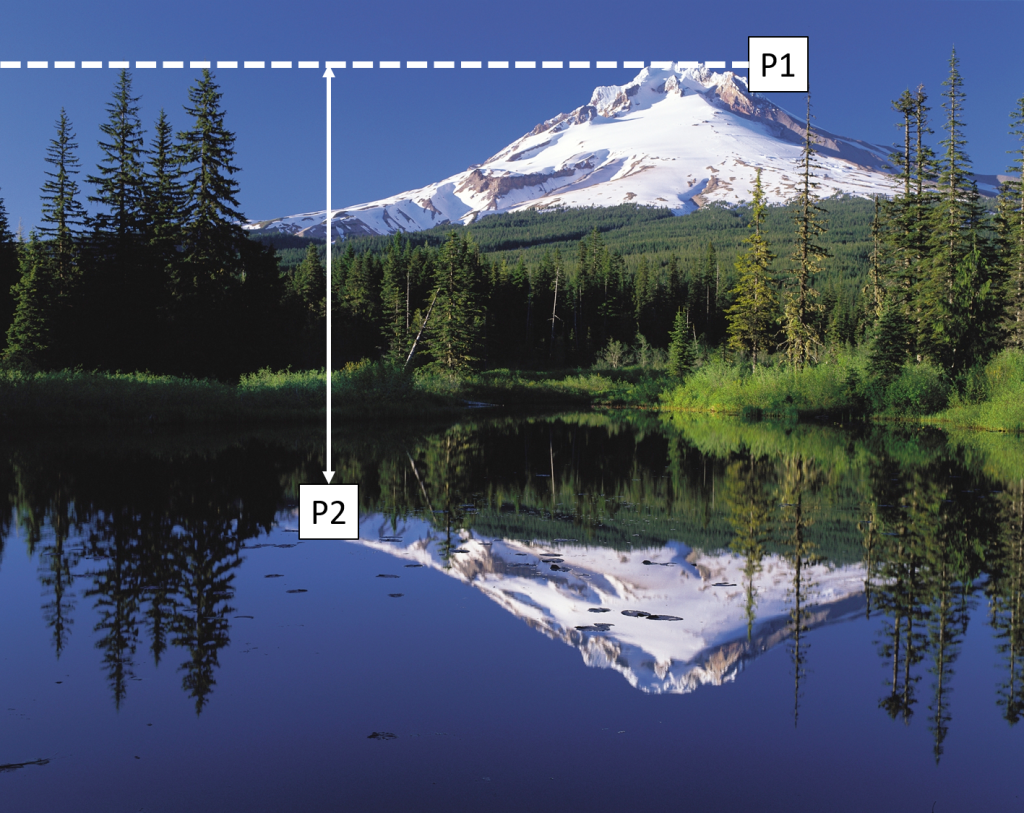
When comparing surface pressure to sea-level pressure, surface pressure is almost always the lower of the two. Taking an average of sea-level pressures over the globe gives a value of 1013.2 mb. This value is called standard sea-level pressure or 1 atmosphere (1 atm).
The most common method to measure surface pressure is with an aneroid barometer. An aneroid barometer consists of sealed metal cylinder (box) that expands and contracts as the air pressure changes. This cylinder is connected to a needle and calibrated to a scale for taking readings.

Video: Measuring Pressure (4:00 min)
3.2.2 Ideal Gas Law
The pressure in a sealed container can be changed by either (1) putting more air in the container or (2) heating or cooling the container. Hence, pressure is related to both density and temperature. In this diagram, which of these boxes containing air has the highest pressure?

When looking at these boxes, “C” appears to have the most air molecules and is a good answer. “C” is the correct answer if the boxes all have the same temperature. However, information on temperature is not known. If “A” was much warmer than “B” or “C”, it could have the highest pressure. This example illustrates that pressure is dependent upon both density and temperature.
The Ideal Gas Law, also referred to as the Equation of State, relates pressure (P), density (ρ) and temperature (T). In this equation, “R” is a constant.
P = ρRT
The general form of the Ideal Gas Law used in many science courses is PV = nRT. In this form V is volume and n is the number of moles of gas. The composition of the atmosphere is relatively constant, so n/V is translated into the density (ρ) variable. Density does decrease with height in the atmosphere, although much slower than pressure or temperature. Pressure changes dramatically with height and is easy to measure. Likewise, temperature changes with height and is easy to measure too. Thus, this form of the Ideal Gas Law using density is the best form for the atmospheric sciences.
The physical aspect of the Ideal Gas Law tells us that pressure varies directly with temperature. If temperature increases, then pressure increases. If temperature decreases, then pressure decreases. The effects of the Ideal Gas Law can be observed in many situations. For example, when pumping up a bicycle tire with a hand pump, the pump gets warm. The pressure increases which has a corresponding temperature increase in the pump. When using a can of spray paint, the pressure inside the can decreases and the can cools.
Video: Ideal Gas Law (5:04 min)
3.2.3 Vertical versus Horizontal Pressure Characteristics
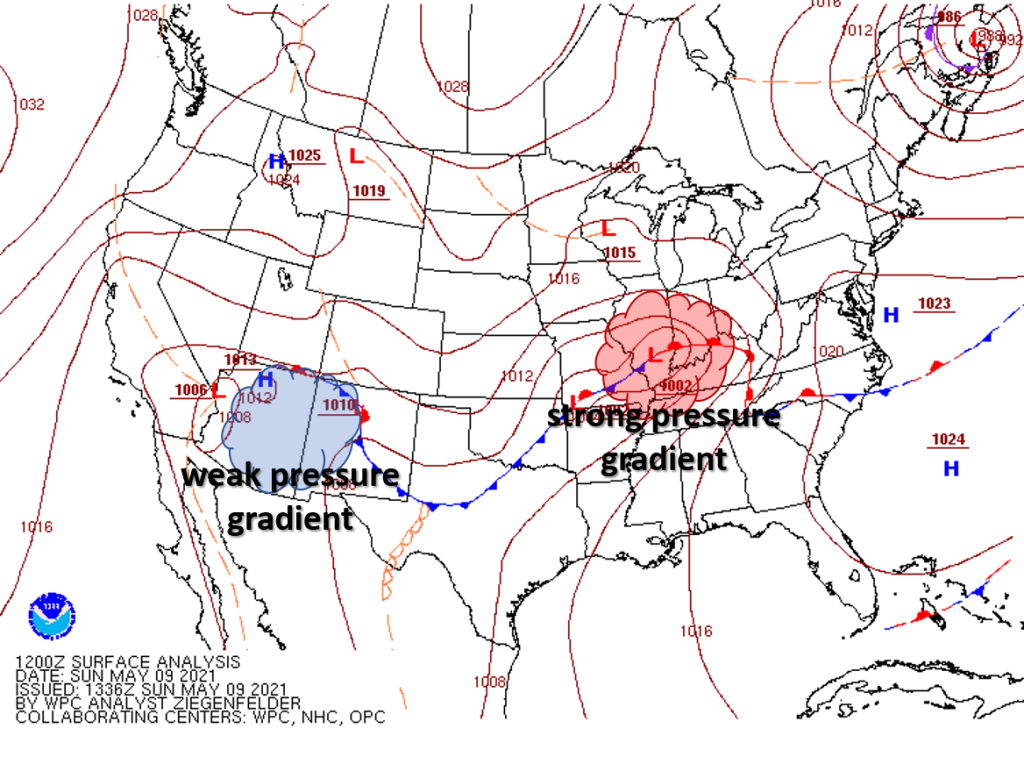
The sea-level pressure at a location is constantly varying. On a map, isobars are analyzed every 4 mb. A typical sea-level pressure map has an “H” or “L” placed over higher or lower pressure areas. The map below has colored lines with triangles and half circles called fronts. The fronts on the map can be ignored for now. The important aspect in this diagram is the isobars.

The lowest pressure in the U.S. on the above map is 1002 mb in Illinois and Missouri. The highest pressure is 1025 mb in northern Idaho. The distance between these two locations is over 3000 km with a change of 23 mb. Pressure changes across a horizontal distance are not large. Pressure changes over a similar distance in the vertical are much larger. From the Earth’s surface to 3000 km in the vertical (in the exosphere), the pressure is near zero. A change of over 1000 mb.
Contour maps can be thought of as topographical maps in some respects. The low pressure area in Illinois and Missouri can be visualized in three-dimensions as a valley. The high pressure in Idaho as a hill. Air flows from higher pressure areas (hills) into lower pressure areas (valleys). This aspect of air movement (wind) is the topic of the next submodule.
3.2.4 Pressure Gradient Force
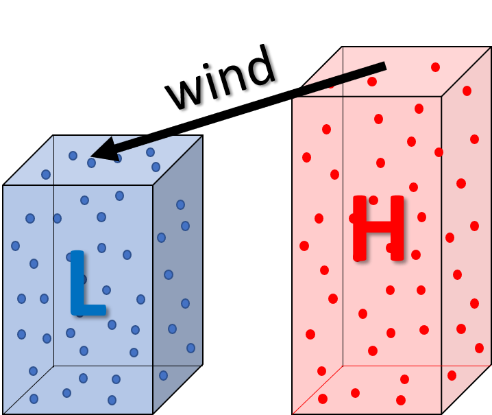
A pressure gradient is the rate of change in pressure across a distance. Pressure gradients are easy to determine in a sea-level pressure analysis. The closer the isobars are to each other, the higher the pressure gradient. The further apart the isobars are to each other, the lower the pressure gradient. These pressure gradients are important because they create a force which generates wind. The pressure gradient force is a force that results from a difference in pressure. The difference in pressure causes air to move and creates wind.
Air (wind) always moves from high pressure to low pressure. Always! You already know this fact if you have ever had a flat tire. A normal tire has higher pressure inside it than outside. If the tire is punctured, the higher pressure air moves to the lower pressure outside until the pressures are equal inside and out.
The stronger the pressure gradient force, the stronger the wind. A weak pressure gradient force has weak or calm winds associated with it.

Since we now know wind moves from high to low pressure, what keeps air from leaving the Earth? Pressure outside the atmosphere is zero. A strong pressure gradient force exists from sea-level at 1013.2 mb to 0 mb outside the atmosphere. The answer to this question is the gravitational force, which is what creates air pressure in the first place. The gravitational force balances the pressure gradient force in the vertical. This balance of forces is called hydrostatic equilibrium. Hydrostatic equilibrium is normally maintained at all altitudes in the atmosphere.
Video: Pressure Gradient Force (4:24 min)
3.2.5 Upper Atmosphere Pressure Gradients
All the pressure gradients examined so far have been on the surface. Obviously, pressure gradients exist aloft, since winds occur aloft and a pressure gradient force is associated with these winds. Let us now explore pressure gradients aloft. This exploration will be confined to the troposphere, because that is where most of the atmosphere resides and where weather occurs.
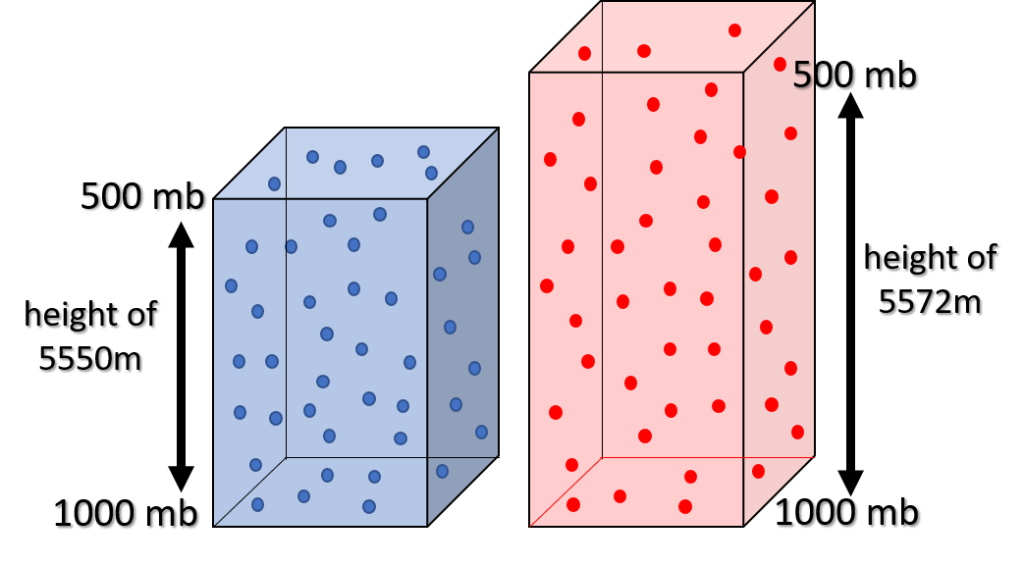
Examining a cool and warm column of air at the same pressure, the warmer column of air must have a larger volume. Applying the Ideal Gas Law (P = ρRT), the pressure (P) is same in both columns. The temperature is not the same, one is warmer than the other. The only variable left to balance the equation in this Law is density (ρ). If temperature is higher, density must be slightly lower. If both columns have the same number of air molecules, the height of the warmer air column must be higher to offset the warmer temperature. The higher column has a larger volume, which causes the density to be lower. Remember the number of gas molecules in each column is the same.
In a sea-level pressure analysis, all surface pressures are converted to sea-level to avoid problems with elevation. Once off the surface of the Earth, analyses are performed on constant pressure surfaces. The height of a specific pressure for a site is placed on the map. An analysis is done on the height data as shown in this 500 mb map. The height contours are the dark lines. Isotherms or temperature contours are the red dash lines.

The station model is used to display data on constant pressure maps, the same as surface maps. The temperature and dewpoint value are in the same location. Since this map is for a constant pressure of 500 mb, the height value is placed in the pressure location. Commonly used pressure surface values and their approximate heights are below. The actual height of these pressures at a location varies because the temperature of the air is always changing.
| Pressure Level | 850 mb | 700 mb | 500 mb | 300 mb |
|---|---|---|---|---|
| Approximate Height | 5,000 feet | 10,000 feet | 18,000 feet | 30,000 feet |
A 500 mb map looks like a sea-level pressure analysis. Can these maps be used to determine pressure gradients? The answer is “yes”. Air flows from higher to lower heights. When height lines are closer together, they indicate a stronger pressure gradient and stronger winds. Conceptually height lines can be treated as if they were isobars. Additionally, higher heights (pressure) aloft indicates warmer air resides in an area than lower heights, which is accurate.
Video: Upper Atmosphere Pressure Gradients (4:59 min)
This video discusses the approach of using the height of a pressure surface for upper level analyses in the troposphere.
3.2.6 Pressure Gradients Across a Hemisphere
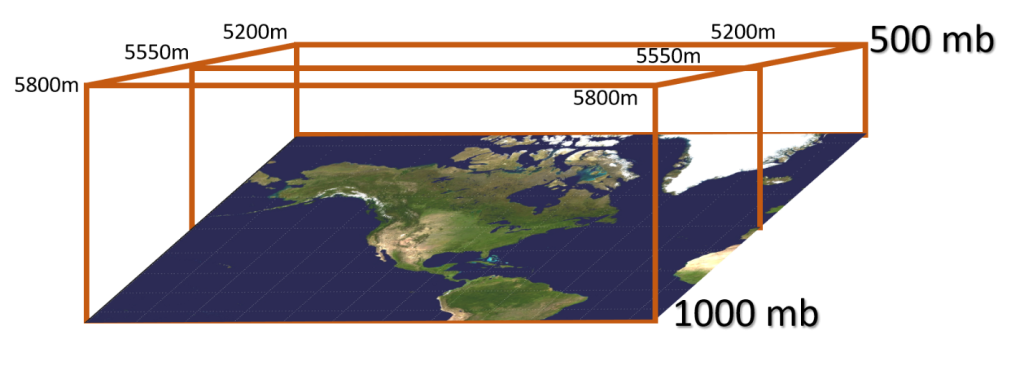
If accurate, the height and temperature concepts presented in the previous submodule should be present on the Earth. The tropics are always warmer than the poles. Therefore, the tropics should have higher 500 mb heights and the poles’ lower heights. The pattern should look like this diagram with the height of 500 mb getting shorter towards the pole.
Analyzing real 500 mb data for the winter of 2021 provides us this map:
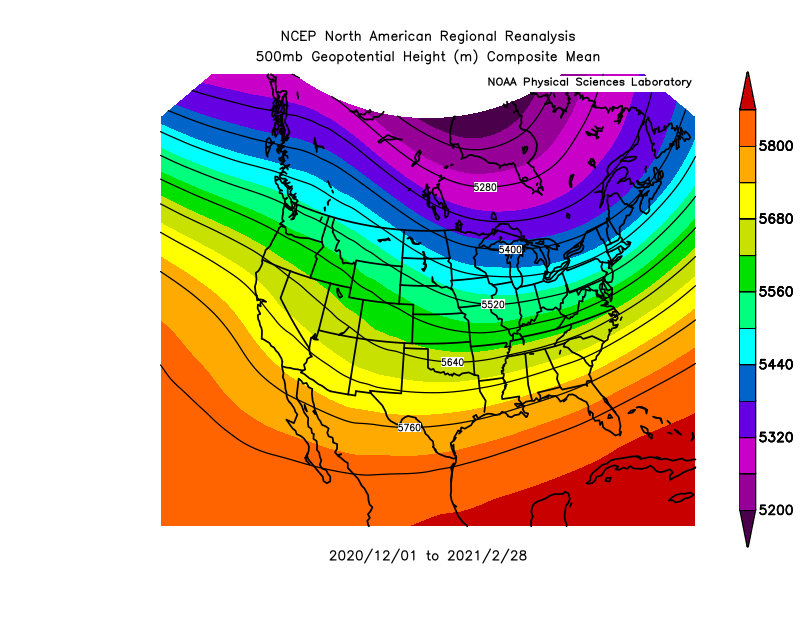
As shown, higher heights are present towards the tropics and lower heights are near the poles. A wave or dip exists in these heights across the central U.S., but the basic concept of pressure gradient force and using the height of a pressure surface for an analysis of the atmosphere is valid.
The primary force affecting the wind is the pressure gradient force. However, two other forces or effects can influence the wind. These other forces are the Coriolis Effect and friction. The next two submodules discuss these forces to complete the fundamentals of pressure and wind.
Video: Pressure Gradients Across a Hemisphere (2:49 min)
This video presents the concept of using heights to represent pressure fields aloft. A reality check examining real data is done to verify that this conceptual model of the atmosphere is correct.
3.2.7 Coriolis Effect
The Coriolis Effect results from the Earth’s rotation and alters only the wind direction, not the wind speed. Frequently the Coriolis Effect is referred to as the Coriolis force. Both terms are correct. The Coriolis Effect influences everything traveling long distances over the earth, like airplanes, wind currents, ocean currents, missiles, or migrating birds. The Coriolis Effect deflects objects to the right in the Northern Hemisphere and to the left in the Southern Hemisphere. The reason for this deflection is different parts of the Earth move at different speeds.
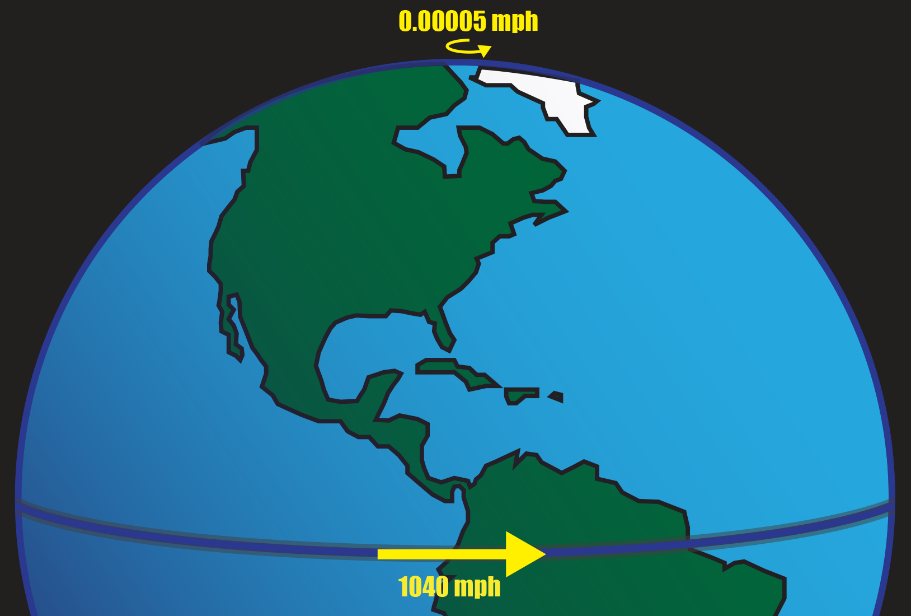
The Earth takes 24 hours to complete a rotation. If you are standing 1 foot to the right of the North or South Pole, that means it takes 24 hours to move in a circle about 6 feet in circumference. Your speed would be about 0.00005 mph. At the equator, the 24 hours rotation is still present, but you would travel the entire circumference of the Earth in this time. The Earth’s circumference is about 25,000 miles so your speed is almost 1040 mph. The farther from the equator, the slower a person moves.
How does this speed difference prevent objects from traveling in a straight line? Good question! Now think about this: You are on a train traveling at top speed and are passing a train that is moving slower. You see a soccer goal on this slower train and have a soccer ball along.
You take an incredible shot directly at the goal when you are across from it. Even though your aim is perfect, the ball travels to the side and misses the net. The reason the ball misses is because it is traveling not only towards the goal, but it also has the faster speed of your train.
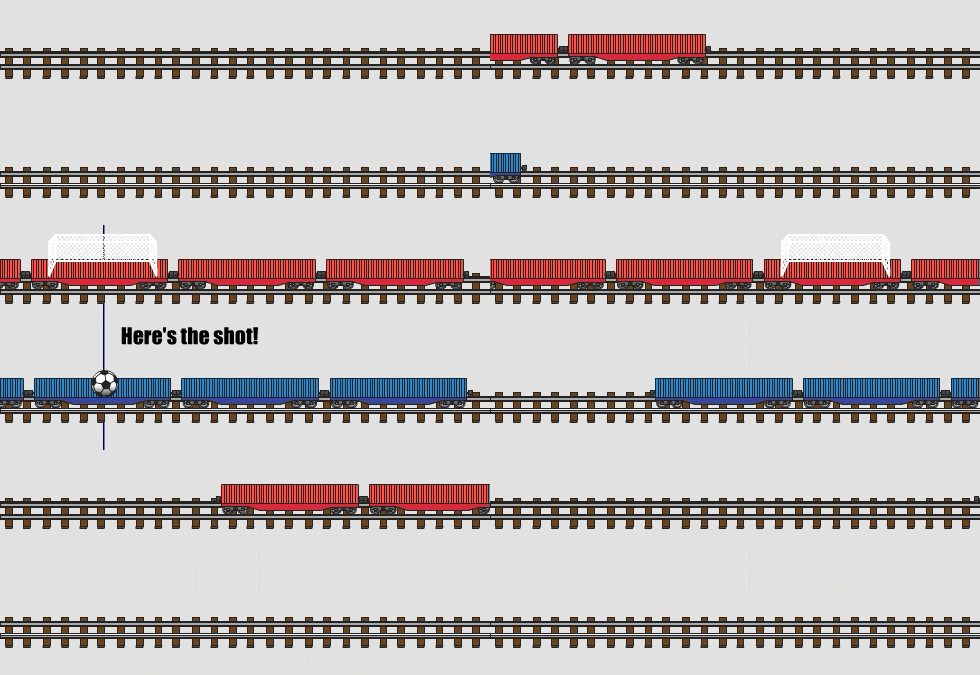
These trains are similar to the Earth. The faster train is near the equator the slower train is closer to the pole. If the Earth was not rotating, everything would move in a straight line. A rotating Earth causes the deflection.
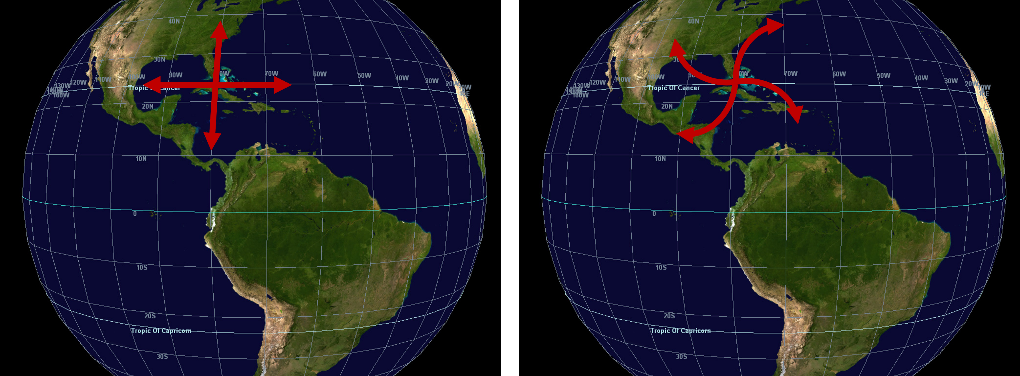
A summary of the important aspects of the Coriolis Effect are:
- Deflects an object to the right in the Northern Hemisphere.
- Increases the deflection as the speed of the object increases.
- Only changes the direction, never the speed of an object.
- Is zero at the equator and reaches a maximum near the poles.
References:
Mt Hood pressure example.png – Public domain from WikiCommons at https://commons.wikimedia.org/wiki/File:Mount_Hood_reflected_in_Mirror_Lake,_Oregon.jpg. Modified to place pressure symbols.
Aneroid_Barometer_(PSF).png – Public domain from WikiCommons at https://commons.wikimedia.org/wiki/File:Aneroid_Barometer_(PSF).png
Barometer_Maximum_1985.jpg – Public domain from WikiCommons at https://commons.wikimedia.org/wiki/File:Proteus_Barometer,_Maximum_Inc.,_1985_-_Museum_of_Science_and_Industry_(Chicago)_-_DSC06350.JPG
tire analogy.png – From public domain images on WikiCommon. Flat tire from https://commons.wikimedia.org/wiki/File:Flat_Tire.JPG Normal tire from https://commons.wikimedia.org/wiki/File:Jaguar_XJ_Roulette_(7×15%22)_alloy_wheel.jpg
500_210509_12.gif – Public domain image from NOAA, NWS and available at https://www.spc.noaa.gov/obswx/maps/
theoretical 500mb heights.png – Public domain Mercator map from WikiCommons at https://commons.wikimedia.org/wiki/File:Mercator-projection.jpg Added 500mb heights.
real 500mb height.png – Public domain from NOAA at https://psl.noaa.gov/cgi-bin/data/narr/plotday.pl
Some text used from NOAA at https://scijinks.gov/coriolis/
earth-rotate.png – Public domain from NOAA at https://scijinks.gov/coriolis/
Earth with and without Coriolis.png – Public domain Earth globe from NASA at https://ti.arc.nasa.gov/tech/cas/advanced-exploration-knowledge-networks/world-wind/screenshots/globe/

