3.3 Applying the Forces Which Affect Wind

3.3 Forces Which Affect Wind

Three forces affecting wind have been identified:

  • Pressure gradient force
  • Coriolis force
  • Friction

Additionally, we have the methods for analyzing pressure (1) at the surface using sea-level pressure isobars and (2) aloft using heights at a set pressure value (like 500 mb). Applying these techniques and knowledge will enable us to expand our understanding of the atmosphere even further. This next submodule applies these principles to accomplish that goal.


3.3.1Winds Aloft

The wind above the boundary layer is assumed to be frictionless. These winds do not encounter the Earth or any vegetation or structure on the Earth. With no friction only two forces are left to analyze (1) the pressure gradient force and (2) the Coriolis force. Examining the pressure gradient force, we know that wind moves from high to low pressure. We also know that higher heights are present closer to the tropics and lower heights closer to the poles. This situation has air moving from higher to lower or from south to the north.
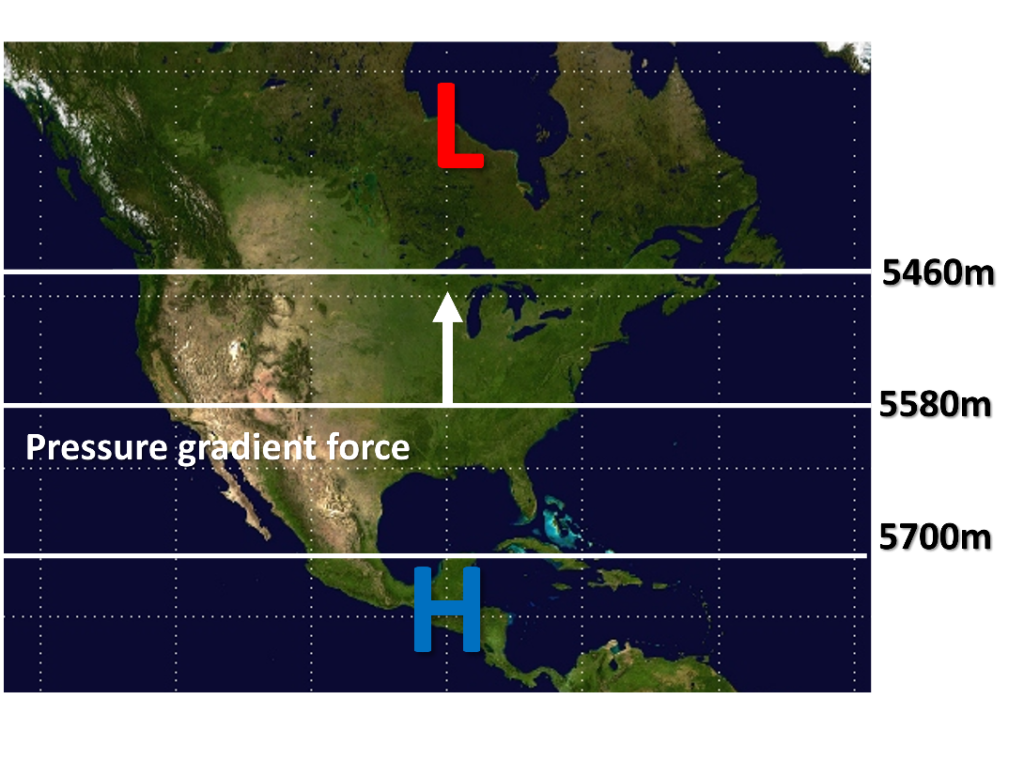
Now considering the Coriolis force, the direction of the wind will be deflected to the right. The wind speed associated with the pressure gradient force remains the same. However, the stronger the wind speed the more deflection to the right due to the Coriolis force.
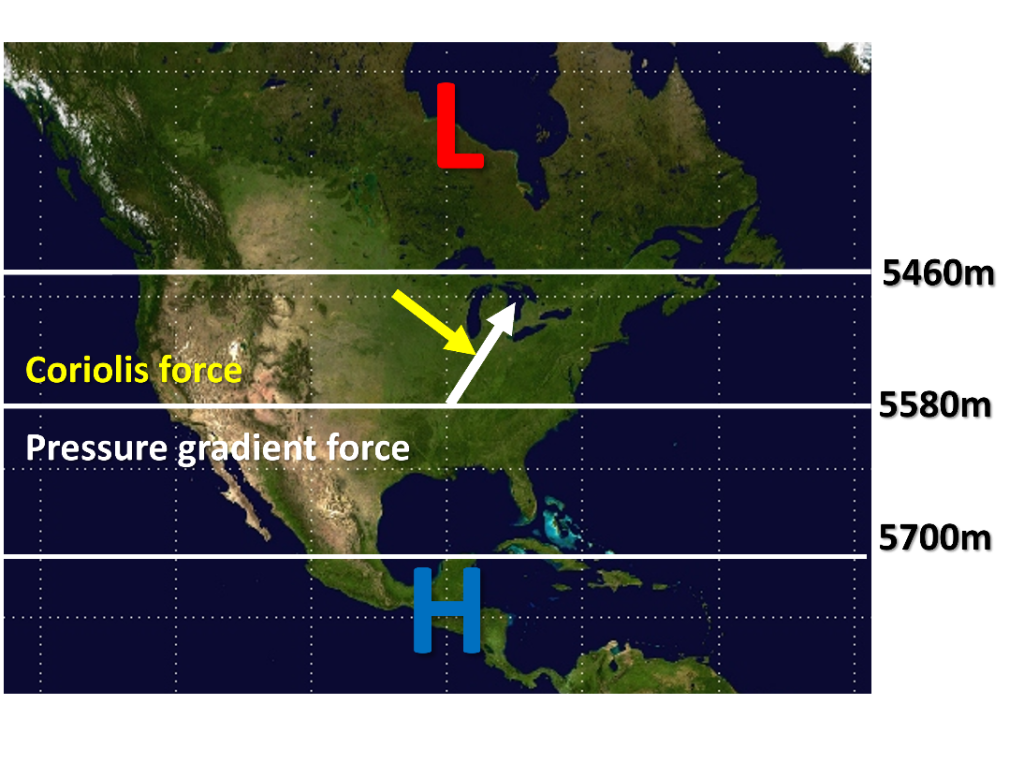
Eventually the pressure gradient and Coriolis forces must balance. When balance occurs, the wind will be parallel to the height contours.

If the wind were to turn further south, its speed would decrease going against the pressure gradient force. A slower wind speed reduces the Coriolis force. A weaker Coriolis force would shift the wind back north to restore the balance.
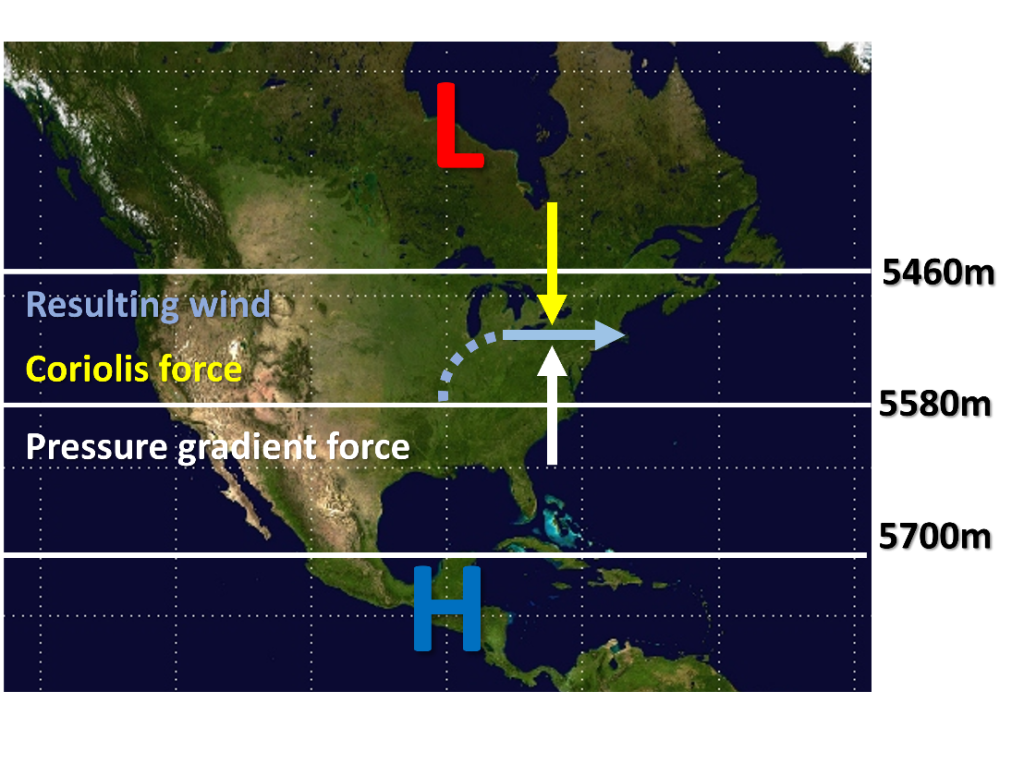
Geostrophic flow or geostrophic balance is defined as when the pressure gradient and Coriolis forces are equal and the wind is at a constant speed. Once established, geostrophic flow is very stable and can be observed in the upper atmosphere.

The real atmosphere, unlike the previous illustrations, does not have a uniform pressure gradient with straight lines. Variations in the pressure gradient cause the wind to speed up and slow down. These changes in speed also result in changes in the Coriolis force. A balance between the Coriolis and pressure gradient forces, although with wind speed changes, is called gradient flow. Gradient flow is much more common in the atmosphere and the wind still flows parallel to the height contours. The biggest difference between geostrophic and gradient flows is that the wind speed varies in the gradient flow.

Examining the 500 mb map shown previously in this module provides an illustration of both geostrophic and gradient flows. Notice the wind and heights over Arizona and New Mexico. The height lines are straight. The winds are a constant speed and direction across the area. These characteristics are associated with geostrophic flow. Looking at the eastern U.S., the height contours have a wavy appearance and the wind speed varies from 15 to 60 knots across the area. These characteristics are associated with gradient flow. In both examples, the winds are parallel to the height contours.


500 mb height analysis for the U.S. dated May 9, 2021 at 12Z. Areas of geostrophic and gradient winds are highlighted.

Video: Winds Aloft (4:37 min)

This video discusses geostrophic and gradient flows and how they develop.


3.3.3 Vertical Motions Associated with Wind

We know that air still moves from higher to lower pressure due to the pressure gradient force. Friction at the surface causes wind to cross the isobars. With wind crossing the isobars, air truly does move away from a high pressure center and into a low pressure center. In the illustration below, the black lines are isobars at the surface. The blue and red arrows represent the wind motion.


When air leaves a high pressure center, it must be replaced. The only available air is from above. Therefore, air descends from aloft to replace the surface air moving away from a high pressure. Air descending in the atmosphere warms. Remember the Ideal Gas Law, if pressure increases a corresponding temperature increase should occur. Air aloft is at a lower pressure than air at the surface. As air descends the pressure on it increases which causes a corresponding increase in temperature. These circumstances are why fair weather is often associated with high pressure.


A low pressure center has the opposite situation. As air comes into a low pressure center, it needs to go somewhere. The air cannot go into the ground, which means it must rise. Therefore, the air associated with a surface low pressure must be ascending. Ascending air cools. As air cools, condensation is favored which promotes clouds and possibly precipitation. Low pressure areas are often associated with inclement weather.

A quick look at the low pressure from the previous surface analysis shows the wind blowing into the low centers. Hence, real data assists in verifying these conceptual models of pressure and wind.


Surface analysis for the eastern U.s. on May 9, 2021 at 12Z.

Video: Vertical Motion Associated with the Wind (4:43 min)

This short video discusses the vertical motions of high and low pressures, and the weather associated with them.


3.3.4 Cyclones and Anticyclones

High and low pressure centers are present across the globe every day. They are not randomly distributed but usually alternate with each other across an area. Because of their common occurrence, these pressure centers have been named. Cyclones are enclosed circular isobars or heights of low pressure. Anticyclones are enclosed circular isobars or heights of high pressure. Cyclones is also a generic name associated with hurricanes, winter storms, thunderstorms or any stormy weather in general. Most inclement weather is associated with a low pressure area, which could be why “cyclones” are often in the news.

In the northern hemisphere, anticyclones rotate in a clockwise manner; cyclones in a counterclockwise direction. This rotation direction is due to the Coriolis Effect. For the southern hemisphere, everything rotates in the opposite direction. This change in direction based on a hemisphere can be confusing. Hence all the illustrations in this course are based on the northern hemisphere to reduce confusion.

At the surface, cyclones and anticyclones normally have a circular isobar or height associated with them. Aloft these pressure areas tend to “open up” into a larger area of high or low pressure without an enclosed circular contour. An area of low pressure aloft is called a trough. An area of high pressure aloft is called a ridge. This illustration helps visualize a trough and ridges.

A trough has lower heights and the cooler air associated with these heights. A ridge has higher heights and warmer air. Looking at the 500 mb and surface analyses used previously in this module, notice the closed contours associated with the surface low in Illinois and Missouri are not present at 500 mb. At 500 mb a broad trough is present across the United States, similar to the illustration above.

Many times, troughs at 500 mb tend to be further west than the surface low pressure. The center of the 500 mb trough in this map is closer to the eastern portion of New Mexico, Colorado and Wyoming rather than Illinois and Missouri. This vertical tilt is conducive to maintaining the strength of a storm and will be discussed in more detail in a future module.


References:

Some text and composition percentages used from the public domain NWS Jetstream at https://www.weather.gov/jetstream/atmos_intro

air glow.jpg – from NASA (public domain) at https://www.nasa.gov/sites/default/files/thumbnails/image/iss064e053173.jpg

co2_data_mlo.jpb – from NOAA (public domain) at https://www.noaa.gov/news/global-carbon-dioxide-growth-in-2018-reached-4th-highest-on-record

ch4_trend_all_gl.png – from NOAA (public domain) at https://www.esrl.noaa.gov/gmd/ccgg/trends_ch4/

Map clipped from public domain Mercator map on WikiCommons at https://commons.wikimedia.org/wiki/File:Mercator-projection.jpg Modified by adding text, lines, arrows and labels.

geostrophic and gradient example.png – Public domain image from NOAA, NWS and available at https://www.spc.noaa.gov/obswx/maps/ Modified with annotation.

usfntsfc2021050912 with obs.gif – Public domain from NOAA, NWS at link here

surface air flow.png – Public domain from NOAA, NWS at https://www.weather.gov/jetstream/wind

usfntsfc2021050912 with obs.gif – Public domain from NOAA, NWS at link here. Clipped so only low pressure area is shown.

3d_trough_ridge.png – Public domain from NOAA, NWS at https://www.weather.gov/jetstream/verses

3d 500 mb and surface.png – Public domain from NOAA, NWS as before but configured into a 3D image


License

Icon for the Creative Commons Attribution 4.0 International License

Exploring Weather and Climate Copyright © by Glen Sampson is licensed under a Creative Commons Attribution 4.0 International License, except where otherwise noted.