2.2 Probability Fundamentals

2.2: Probability Fundamentals
Learning Objectives
Upon completion of this section, you should be able to
- Define a sample space for a random experiment.
- Identify events for a random experiment.
- Compute theoretical and experimental probabilities for events.
- Compute probabilities for events with equal likely outcomes.
Law of Large Numbers
Many events in the world around us exhibit random patterns, but by repeated observations of such events it can often be seen to predict long-term patterns (despite random, short-term fluctuations). Probability is simply the branch of mathematics devoted to the study of these events. The probability of a specified event or outcome is the chance or likelihood that it will occur.
Probability
The probability of any outcome (a particular result in an experiment) is the long-term relative frequency of that outcome.
 |
What is the probability of a Head in a coin toss? How do you know that? |
|---|
There are several ways of answering that question above about probability. One approach is called theoretical in that we use logic or knowledge about the event of interest and assign a probability. For this coin example we could use logical reasoning to say that each side of the coin has the same chance of landing upright when flipped, so we would assign the probability as for being a heads. This theoretical value comes with some assumptions typically (the coin is balanced equally throughout, the player is not attempting to manipulate the toss, etc...).
Another approach is called empirical (also called experimental). This is where we repeatedly conduct an experiment and assign the probability to be the ratio of times we observed the event to the number of trials in the experiment. Suppose we flipped that coin 1000 times and heads occurred 529 times. We could assign the probability of being a head on a flip as the ratio .
Theoretical and Empirical Probability
The expected ratio (relative frequency) of an event occurring, based on mathematical calculations or logical reasoning. It is determined by analyzing the possible outcomes of a situation without conducting experiments.
Empirical Probability:
The ratio (relative frequency) of an event occurring, based on actual experiments or collected data. It is calculated by dividing the number of times an event occurs by the total number of trials or observations.
In 1777, Georges-Louis Leclerc, Comte de Buffon, reported flipping a coin 4,040 times, resulting in 2,048 heads . This experiment, recorded in his "Essai d'Arithmétique Morale," was one of the earliest large-scale empirical probability studies (Stigler, "The History of Statistics" 1986).
Let's imagine following Buffon's process, but with 1,000 coin flips instead of 4,040. After 10 flips, we might see 7 heads, giving an empirical probability of 70% for heads. This seems far from the expected 50% for a fair coin. But what happens as we continue flipping? As the number of flips increases, something interesting occurs. The percentage of heads tends to get closer and closer to 50%. After 100 flips, we might see 53 heads, or 53%. After 500 flips, perhaps 252 heads, or 50.4%. And after all 1,000 flips, we could end up with 503 heads, or 50.3%.
This phenomenon, where the empirical probability converges towards the theoretical probability as the number of trials increases, is called the law of large numbers. It suggests that with a large enough sample size, our observed results will approach the true probability.
Law of Large Numbers
The Law of Large Numbers states that as the number of repetitions of an experiment is increased, the ratio of an observed event obtained in the experiment tends to become closer and closer to the theoretical probability.
The law of large numbers doesn't guarantee that we'll get exactly 50% heads after 1,000 or even 4,040 flips, but it does tell us that we're likely to get very close. This principle is crucial in many fields, from scientific research to opinion polling, where larger sample sizes generally lead to more accurate results.
Example 1
Suppose you took a fair six-sided die, with the numbers 1, 2, 3, 4, 5, and 6 on its faces, and rolled it 100 times. Those outcomes are summarized in the table below.
- Based on the table what is the probability of rolling a 5?
- If we were to roll the die 10,000 times instead what would we expect the ratio of observed 5's to be close to?
| Dice Outcome | Frequency |
|---|---|
| 1 | 21 |
| 2 | 14 |
| 3 | 18 |
| 4 | 11 |
| 5 | 24 |
| 6 | 12 |
Solution
- In the table we see that an outcome of 5 is rolled 24 times out of the 100 trials of the experiment of rolling that die. This tells us that the empirical probability of rolling a 5 is the ratio or 24%.
- As we roll that die more often (10,000 instead of 100 times) we would expect the ratio of observed values of 5 to approach the theoretical probability of rolling a 5. If the die is fair we expect to see an equal number of 5's rolled when comparing to any of the other number on the other faces of the die. There are six sides and the 5 side is just one of those 6, so that would mean our theoretical probability would be the ratio or .
It is important to realize that in many situations, the outcomes are not equally likely. A coin or die may be unfair, or biased.  Look at the dice in a game you have at home; the spots on each face are usually small holes carved out and then painted to make the spots visible. Your dice may or may not be biased; it is possible that the outcomes may be affected by the slight weight differences due to the different numbers of holes in the faces. Gambling casinos make a lot of money depending on outcomes from rolling dice, so casino dice are made differently to eliminate bias. Casino dice have flat faces; the holes are completely filled with material of a different color, but having the same density as the material that the dice are made out of so that each face is equally likely to occur. Later we will learn techniques to use to work with probabilities for events that are not equally likely.
Sample Spaces and Events
If you roll a die, pick a card from deck of playing cards, or randomly select a person and observe their age, we say we are conducting a random experiment, an action for which all possible outcomes can be listed, but for which the actual outcome on any given trial of the experiment cannot be predicted with certainty. In probability, we look at the likelihood of an outcome or a collection of outcomes that we call an event in the random experiment.
We begin with some terminology.
Definitions
Random experiment: A process with an uncertain outcome that can be repeated under the same controlled conditions.
Sample space: The set of all possible outcomes of a random experiment.
Event: A subset of the sample space, representing a collection of possible outcomes.
Simple event: An event consisting of exactly one outcome from the sample space.
Example 2
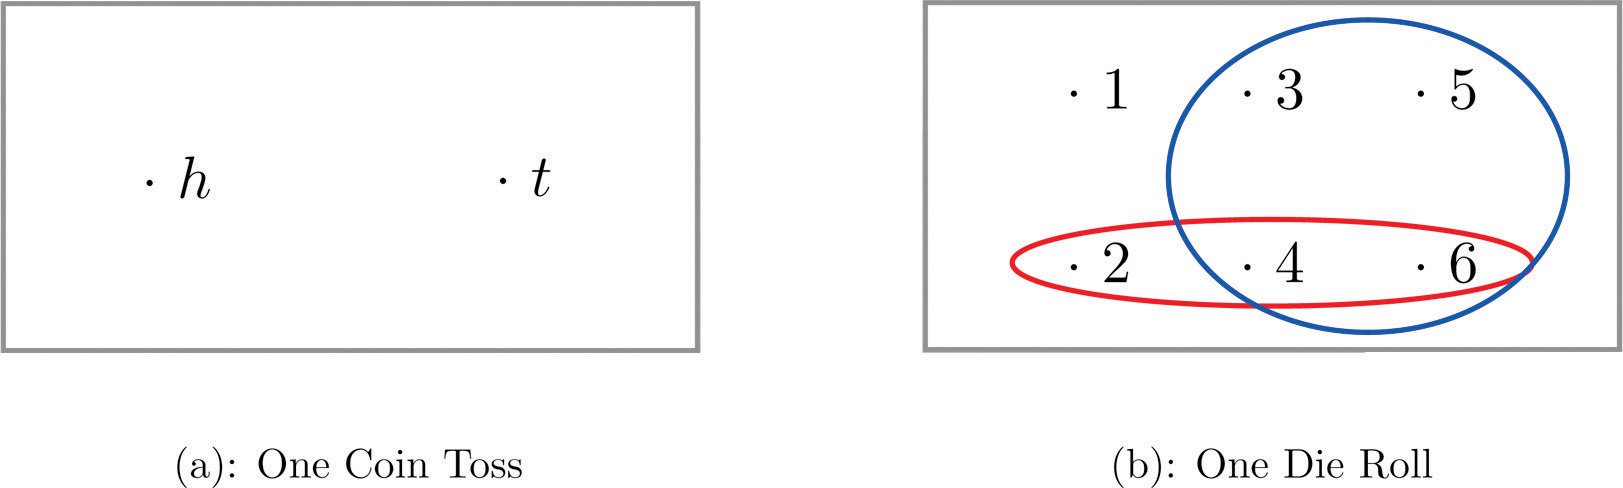
Construct a sample space for the experiment that consists of tossing a single coin and observing which side is facing up when it lands.
Solution
The outcomes could be labeled h for heads and t for tails. The sample space is the set .
Whether the coin was fair or not does not factor into the creation of this sample space. It is purely a collection of all outcomes for flipping the coin and recording which side is showing up.
Example 3
Construct a sample space for the experiment that consists of rolling a standard single die. Find the events that correspond to the phrases “an even number is rolled” and “a number greater than two is rolled.”
Solution
The sample space is the set of all possible simple events:
The event “an even number is rolled” would be the collection of all even numbers. We will call this event E and would be:
The event “a number greater than two is rolled.” would be the collection of all numbers larger (greater) than 2. We will call this event F and would be:
The choice of the letter for an event is similar to the choice for a letter in a variable in an algebra application. We pick one that will hopefully help with the meaning of the event in terms of the application. The letter E was a natural choice for the event of an even number in the dice rolls, so it was used. The other event didn't have a natural choice so we picked a letter close to E and didn't have any inferred meaning in the application.
A graphical representation of a sample space and events is a Venn diagram, as shown below "Venn Diagrams for Two Sample Spaces". In general the sample space S is represented by a rectangle, outcomes by points within the rectangle, and events by ovals that enclose the outcomes that compose them.
A device that can be helpful in identifying all possible outcomes of a random experiment, particularly one that can be viewed as proceeding in stages, is what is called a tree diagram. It is described in the following example.
Example 4
Construct a sample space that describes all three-child families according to the binary genders of the children with respect to birth order. For simplicity we are only using the binary genders, but recognize there are those who identify as nonbinary.
Solution
Two of the outcomes are “two boys then a girl,” which we might denote bbg, and “a girl then two boys,” which we would denote gbb. Clearly there are many outcomes, and when we try to list all of them it could be difficult to be sure that we have found them all unless we proceed systematically. The tree diagram below gives a systematic approach.
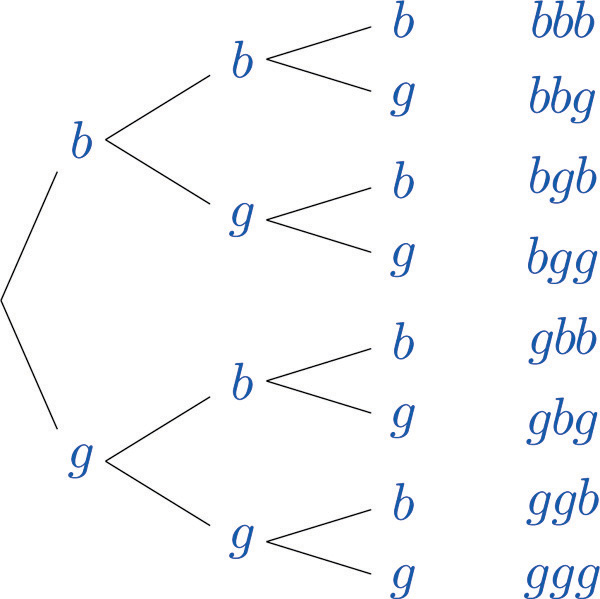
The diagram was constructed as follows. There are two possibilities for the first child, boy or girl, so we draw two line segments coming out of a starting point, one ending in a b for “boy” and the other ending in a g for “girl.” For each of these two possibilities for the first child there are two possibilities for the second child, “boy” or “girl,” so from each of the b and g we draw two line segments, one segment ending in a b and one in a g. For each of the four ending points now in the diagram there are two possibilities for the third child, so we repeat the process once more.
The line segments are called branches of the tree. The right ending point of each branch is called a node. The nodes on the extreme right are the final nodes; to each one there corresponds an outcome, as shown in the figure.
From the tree it is easy to read off the eight outcomes of the experiment, so the sample space is, reading from the top to the bottom of the final nodes in the tree,
Try it Now 1
A random experiment consists of tossing two coins. Write out the sample space assuming we can tell the difference between the two coins.
What outcomes make up the event there is at least one head showing?
Answer (click to Show/Hide)
Since we can tell the coins apart, there are two ways for the coins to differ we can label each outcome as a pair of letters, the first of which indicates how the first coin landed and the second coin landed. A sample space is then .
The event "there is at least one head showing" can be made observed when there is one heads or two heads. We will call the event E and the outcomes are:
Probability
We have mentioned earlier for empirical probability that it represents a ratio of the number of times we observed an outcome over number of trials. With that in mind we will give a more formal definition along with properties that makes sense when we think of probabilities as a ratio.
Probability
The probability of an outcome:
When we perform a random experiment, each possible result is called an outcome. If e is an outcome we denote the probability of e as . The probability of e, , is a number between 0 and 1 that tells us how likely that outcome is to happen in a single trial of the experiment.
- If the probability is 0, the outcome is impossible.
- If the probability is 1, the outcome is certain to occur.
The probability of an event:
An event is a group of one or more outcomes. To find the probability of an event, we add up the probabilities of all the individual outcomes that make up that event. We write the probability of an event E as .
If , then
"Sample Spaces and Probability" graphically illustrates the definitions.
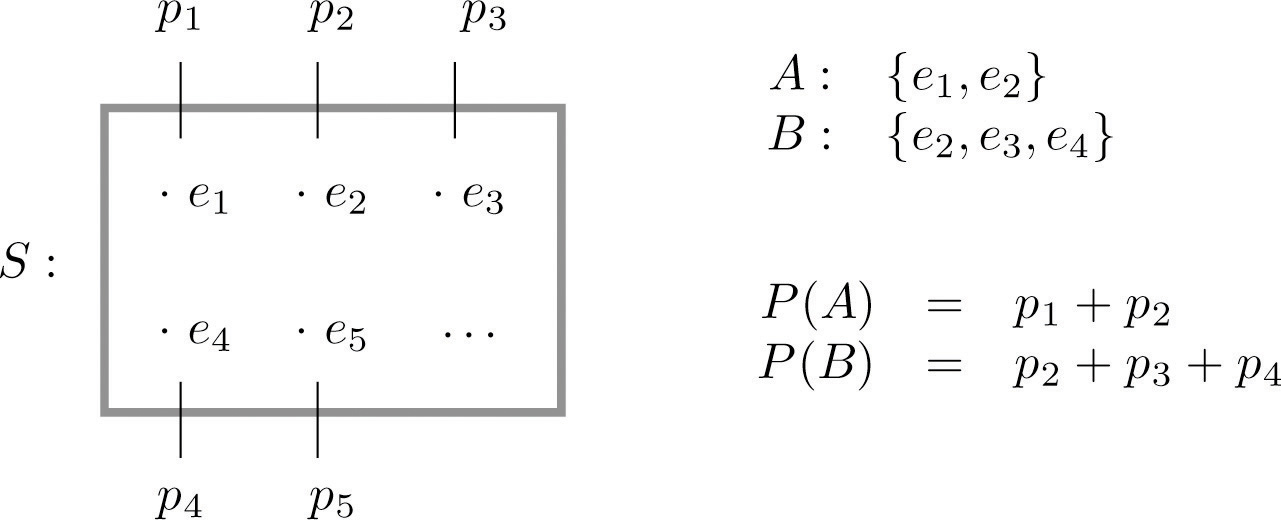
Since the whole sample space S is an event that is certain to occur, the sum of the probabilities of all the outcomes must be the number 1.
In ordinary language probabilities are frequently expressed as percentages. For example, we would say that there is a 70% chance of rain tomorrow, meaning that the probability of rain is 0.70. We will use this practice here, but in all the computational formulas that follow we will use the form 0.70 and not 70%.
It is relatively straight forward to find probability is when all the outcomes have the same chance of occurring. For example experiments where each outcome has the same chance of happening would include the roll of a fair dice, flipping a fair coin, or even the results of a simple random sample from a population. Finding probabilities in these situations is just a matter or counting (as shown in the definition below).
Probability for Equal Likely Outcomes
If an experiment has a finite number of possible outcomes, and all outcomes are equally likely, then the probability of an event E, denoted as P(E), is the ratio of the number of outcomes that make up the event E to the total number of possible outcomes in the sample space S.
The formula is expressed as:
Where:
- n(E) is the number of outcomes in the event E (or we can say favorable to event E).
- n(S) is the total number of possible outcomes in the sample space.
This formula can also be expressed by:
Example 5
A coin is called “balanced” or “fair” if each side is equally likely to land up. Assign a probability to each outcome in the sample space for the experiment that consists of tossing a single fair coin.
Solution
With the outcomes labeled h for heads and t for tails, the sample space is the set . Since the outcomes have the same probabilities, which must add up to 1, each outcome is assigned probability .
We could write these as and .
Example 6
Find the probabilities of the events:
E: “an even number is rolled”
T: “a number greater than two is rolled.”
Solution
With outcomes labeled according to the number of dots on the top face of the die, the sample space is the set .
List out all the even numbers into a collection for the event E: . This event is made up of 3 of the total 6 outcomes we have, so the probability is
List out all the even numbers into a collection for the event T: This event is made up of 4 of the total 6 outcomes we have, so the probability is
Probabilities are essentially fractions, and can be reduced to lower terms like fractions as you saw in the examples, however we may not always do this as the unsimplified fraction may contain more information when reading it then the simplified answer. For instance in the example above we know there was six outcomes on the dice roll and the probability of rolling a number greater than 2 was found to be . If we leave the answer as we keep the information about how many outcomes out of the 6 made up the event rolling a number greater than 2.
Example 7
Let's say you have a bag with 20 cherries where 14 are sweet and 6 are sour. If you pick a cherry at random, what is the probability that it will be sweet?
Solution
There are 20 possible cherries that could be picked, so the number of possible outcomes is 20. Of these 20 possible outcomes, 14 are favorable (sweet), so the probability that the cherry will be sweet is .
There is one potential complication to the cherry picking example, however. It must be assumed that the probability of picking any of the cherries is the same as the probability of picking any other. This wouldn't be true if (let us imagine) the sweet cherries are smaller than the sour ones. (The sour cherries would come to hand more readily when you sampled from the bag.) Let us keep in mind, therefore, that when we assess probabilities in terms of the ratio of favorable to all potential cases, we rely heavily on the assumption of equal probability for all outcomes.
Example 8
A standard deck of 52 playing cards consists of four suits (hearts, spades, diamonds and clubs). Spades and clubs are black while hearts and diamonds are red. Each suit contains 13 cards, each of a different rank: an Ace (which in many games functions as both a low card and a high card), cards numbered 2 through 10, a Jack, a Queen and a King.
- Compute the probability of randomly drawing one card from a deck and getting an Ace.
- Compute the probability of randomly drawing one card from a deck and getting a Diamond.
- Compute the probability of randomly drawing one card from a deck and getting a black card.
Solution
- There are 52 cards in the deck and 4 Aces so
- There are 13 diamonds in the deck, so
- There are two suits that are black for a total of 26 cards, so
Try it Now 2
Two fair coins are tossed. Find the probability that the coins match, i.e., either both land heads or both land tails.
Hint 1 (click to Show/Hide)
We constructed the sample space in the first Try It Now for this chapter. That sample space was . What outcomes make up the event in question?
Answer (click to Show/Hide)
We constructed the sample space in the first Try It Now for this chapter. That sample space was . We are interested in finding the probability of the event .
Now since the coin was fair we can safely assume each of the paired outcomes of the two coins will also be equally likely. This gives us that
Probability Using Counting Techniques
This is really a continuation of finding probabilities from experiments with equal likely outcomes (if the outcomes are not equal likely this method will not work). In these problems we will be using the counting techniques (Fundamental Theorem of Counting, Permutations, and Combinations) to find the number of outcomes in an event and the number of outcomes possible to answer probability questions.
Example 9
In a classroom there are 13 girls and 15 boys. The class is to elect a President, Vice President, and a Treasurer. What is the probability if students were elected at random that all three positions were filled by boys?
Solution
To find the probability we would need to find the ratio of selecting the 3 boys to fill the positions over the number of ways to fill the positions in general. Let E be the event that all 3 boys are selected, then we can say the probability of E is
Start with finding the , number of ways to select the three boys from 15 to fill the positions. We are selecting without replacement (no person can be in more than one position this way). We can count how many ways to select 3 from 15 where order does matter by using permutations.
Next find the number of outcomes in the sample space (that is selecting three from the total class of 28 students for the three positions)
Now take the ratio to find the probability of E
Video Solution Example (4 mins 12 secs - CC)
Example 10
A 4 digit PIN number is selected. What is the probability that there are no repeated digits?
Solution
The probability will be the ratio of number of ways to select the 4 digit pin with no repeated digits over the total number of ways to select a 4 digit pin in general.
There are 10 possible values for each digit of the PIN (namely: 0, 1, 2, 3, 4, 5, 6, 7, 8, 9), so there are total possible PIN numbers.
To have no repeated digits, all four digits would have to be different, which is selecting without replacement. We could either compute , or notice that this is the same as the permutation .
The probability of no repeated digits is the number of 4 digit PIN numbers with no repeated digits divided by the total number of 4 digit PIN numbers. This probability is
Video Solution Example (1 min 47 secs - CC) Another example starts after 1:47 mark on the video.
Example 11
Use combinations to calculate the probability of winning the lottery jackpot when 4 numbers are chosen from 1-29. In the lottery selection the order of the numbers that are picked does not matter.
Solution
Key thing to notice on this problem for start is that the selection of 4 numbers the order doesn't matter. This means we can use combinations for the counting as we have selection without replacement and the order does not matter.
Start with finding the number of ways we can select the 4 winning numbers. You may not be surprised to find out that there is one way for that to happen, but with combinations we would write it as , which when evaluated is equal to 1.
Next find how many ways to select four numbers from the 29. This is found by finding .
The probability of winning is the ratio of the number of ways to select the 4 winning numbers from the 4 drawn over the number of ways to select 4 numbers from 29.
Video Solution Example (4 mins 44 secs - CC)
Example 12
In a certain state's lottery, 48 balls numbered 1 through 48 are placed in a machine and six of them are drawn at random. If the six numbers drawn match the numbers that a player had chosen, the player wins $1,000,000. In this lottery, the order the number are drawn in doesn’t matter. Compute the probability that you win the million-dollar prize if you purchase a single lottery ticket.
Solution
In order to compute the probability, we need to count the total number of ways six numbers can be drawn, and the number of ways the six numbers on the player’s ticket could match the six numbers drawn from the machine. Since there is no stipulation that the numbers be in any particular order, the number of possible outcomes of the lottery drawing is . Of these possible outcomes, only one would match all six numbers on the player’s ticket, so the probability of winning the grand prize is:
Video Solution Example (3 mins 5 secs - CC) Another example starts after the 3:05 mark on the video.
Example 13
In the state lottery from the previous example, if five of the six numbers drawn match the numbers that a player has chosen, the player wins a second prize of $1,000. Compute the probability that you win the second prize if you purchase a single lottery ticket.
Solution
As above, the number of possible outcomes of the lottery drawing is .
In order to win the second prize, five of the six numbers on the ticket must match five of the six winning numbers; in other words, we must have chosen five of the six winning numbers and one of the 42 losing numbers. The number of ways to choose 5 out of the 6 winning numbers is given by and the number of ways to choose 1 out of the 42 losing numbers is given by . Thus the number of favorable outcomes is then given by the Basic Counting Rule: .
The probability of winning the second prize is.
Video Solution Example (1 mins 40 secs - CC)
Try it Now 3
An economics quiz contains 10 questions with five possible answers each. Compute the probability of randomly guessing the answers and getting 9 questions correct.
Hint 1 (click to Show/Hide)
To find the probability that exactly nine of the ten questions were answered correctly we need to count the number of ways nine of the ten are answered correctly and one is answered incorrect over the number of ways to in general answer ten questions.
If we start with the denominator it is usually easier to find. In this case we can use the fundamental counting principle and think of ten slots need to be filled. Each slot is the answer choices (which there are five), so if we take the product of all those choices we get 510.
For the numerator you need to find how many ways can we answer one question incorrect out of the ten.
Answer (click to Show/Hide)
Lets continue the discussion from the hint to find the solution.
For the numerator we again use the fundamental counting principle, but in this case we need to think about how to count getting one question incorrect times how many ways can we get it incorrect. In this counting the order does matter if we look at how many ways can we get one incorrect. Since order matters we use a permutation and see that 10P1 gives the number of ways for the one incorrect out of the ten questions. The fundamental counting principle comes into play here as for each incorrect question there are 4P1 ways to answer that question incorrect (picking one of the four incorrect responses).
Now you may be wondering about those 9 questions answered correctly. Since we already looked at how many ways to mark that incorrect spot all nine correct ones are forced into the other spots. Each correct answer\ only has one choice for marking a correct answer (it is marked correct assuming only one answer gives full credit). So if we were to multiply by the choices for getting the correct answer correct for each correct answer it would be times one nine times, which is just one.
Lets put together the numerator and denominator information together to find the probability of getting nine questions correct and one incorrect on this multiple choice quiz.
Example 14
In a box there are 25 parts in which 3 are known to be defective. If we were to randomly pick 3 from this box what is the probability that none of the 3 would be defective?
Solution
Let E be the event that we select 3 non defective parts from the box. To find the probability of E we take the and divide it by ).
To find we are counting where order does not matter and without replacement, so we can use combinations. We know 3 are defective, so that means the remaining 22 are non defective and we want the number of ways to select 3 of these non defective parts.
Next find where we need the number of ways to select 3 parts from the total 25.
The probability of E is the ratio of and
Video Solution Example (5 mins 52 secs - CC)
In the next example we will need to use both the Multiplication Rule for probability and Combinations.
Example 15
Compute the probability of randomly drawing five cards from a deck and getting exactly one Ace.
Solution
In many card games (such as poker) the order in which the cards are drawn is not important (since the player may rearrange the cards in his hand any way he chooses); in the problems that follow, we will assume that this is the case unless otherwise stated. Thus we use combinations to compute the possible number of 5-card hands, . This number will go in the denominator of our probability formula, since it is the number of possible outcomes.
For the numerator, we need the number of ways to draw one Ace and four other cards (none of them Aces) from the deck. Since there are four Aces and we want exactly one of them, there will be ways to select one Ace; since there are 48 non-Aces and we want 4 of them, there will be ways to select the four non-Aces. Now we use the Multiplication Principle to calculate that there will be ways to choose one ace and four non-Aces.
Putting this all together, we have
Video Solution Example (2 mins 2 secs - CC) Next example starts after 2:02 mark on the video.
Example 16
Compute the probability of randomly drawing five cards from a deck and getting exactly two Aces.
Solution
The solution is similar to the previous example, except now we are choosing 2 Aces out of 4 and 3 non-Aces out of 48; the denominator remains the same:
Video Solution Example (58 secs - CC)
It is useful to note that these card problems are remarkably similar to the lottery problems discussed earlier.
Try it Now 4
Compute the probability of randomly drawing five cards from a deck of cards and getting three Aces and two Kings.
Hint 1 (click to Show/Hide)
The probability is going to be the number of ways we can get the three aces and two kings over the total number of ways we can get five cards in general. For both the numerator and denominator we are going to have to count how many ways each is possible. If we are counting we need a strategy for doing so, the denominator is easiest to set up typically. How many ways can we get five cards from a deck of 52 cards? Is this a permutation or a combination counting problem?
Hint 2 (click to Show/Hide)
The number of ways we can get five cards out of 52 is a combination counting problem since the order of those five cards do not matter. We can find this number by taking .
For the numerator we have to think of this as a fundamental counting principle question as we need to figure out how many ways we get three aces times how many ways to get two kings to find all the ways we get three aces and two kings together. For each of those it again is a counting problem where order does not matter, so we will use combinations to find those numbers.
There are four aces in a deck, so the number of ways to select three of those four aces is going to be .
There are four kings in a deck, so the number of ways to select two kings out of four is going to be .
The fundamental counting principle tells us that the number of ways both will happen is going to be the product.
Answer (click to Show/Hide)
The probability of getting two kings and three aces in a five card hand is going to be the number of ways we can have two kings and three aces over the number of ways we can select five cards from a 52 card deck.
Probability when things are not equally likely
The previous examples illustrate how probabilities can be computed simply by counting when the sample space consists of a finite number of equally likely outcomes. In some situations the individual outcomes of any sample space that represents the experiment are unavoidably unequally likely, in which case probabilities cannot be computed merely by counting, but the computational formula given in the definition of the probability of an event must be used.
Probability of an Event (general)
The probability of an event E is the sum of the probabilities of the individual outcomes of which it is composed. It is denoted .
If , then
Example 17
The breakdown of the student body Race and Ethnicity at Pima Community College in Fall 2020 was 37.33% white, 4.93% black or african american, 47.16% Hispanic, 3.12% Asian, and 1.97% American Indian or Alaskan Native, 5.49% for all others (including undeclared). A student is randomly selected from Fall 2020. (To select “randomly” means that every student has the same chance of being selected.) Find the probabilities of the following events:
- H: the student is Hispanic,
- M: the student is a minority (that is, not white),
Solution
The student body's race and ethnicity is broken down into 6 different outcomes. We can write this out as a sample space of . The experiment is the action of randomly selecting a student from the student population at Pima. Since 47.16% of the students are Hispanic and all students have the same chance of being selected, , and similarly for the other outcomes. This information is summarized below:
| Outcomes | w | b | h | a | ai | o |
|---|---|---|---|---|---|---|
| Probability | 0.3733 | 0.0493 | 0.4716 | 0.0312 | 0.0197 | 0.0549 |
- Look at the outcomes that make up the event: . Since there is only one outcome we can find the probability:
- Start with looking at all the outcomes that make up the event: . To find the probability we can add up each probability of the outcomes to find the probability of the event M:
In the last example the process for adding the probabilities together worked as the classifications of race/ethnicity didn't allow for any of the students to fall into more than one classification as well as all students would be captured into just one of them. If there were overlaps between two classifications we could not treat the probability question in the same way.
Try it Now 5
- B: the student is black or african american,
- MF: the student is a minority female,
- F: the student is female.
Hint 1 (click to Show/Hide)
It may be helpful to organize the data into a table and convert the outcomes in the sample space into probabilities. The sample space would be
Answer (click to Show/Hide)
The sample space would be .
The information given in the example can be summarized in the following table, called a two-way contingency table:
| Gender | Race / Ethnicity | ||||
|---|---|---|---|---|---|
| White | Black or african american | Hispanic | Asian | Others | |
| Male | 0.25 | 0.12 | 0.06 | 0.03 | 0.01 |
| Female | 0.26 | 0.15 | 0.05 | 0.03 | 0.04 |
- Since :
- Since :
- Since :
Exercises
- Which of the following can be a probability value?
Answer (click to Show/Hide)
- A box contains 10 white and 10 black marbles. Construct a sample space for the experiment of randomly drawing out, with replacement, two marbles in succession and noting the color each time. (To draw “with replacement” means that the first marble is put back before the second marble is drawn.)
For each event listed below write out the outcomes that make up the event. If we assume each outcome is equal likely find the probability of each event.
- At least one marble of each color is drawn.
- No white marble is drawn.
Answer (click to Show/Hide)
- :
- :
- A box contains 16 white and 16 black marbles. Construct a sample space for the experiment of randomly drawing out, with replacement, three marbles in succession and noting the color each time. (To draw “with replacement” means that each marble is put back before the next marble is drawn.)
For each event listed below write out the outcomes that make up the event. If we assume each outcome is equal likely find the probability of each event.
- At least one marble of each color is drawn.
- No white marble is drawn.
- More black than white marbles are drawn.
Answer (click to Show/Hide)
- :
- :
- :
- A box contains 8 red, 8 yellow, and 8 green marbles. Construct a sample space for the experiment of randomly drawing out, with replacement, two marbles in succession and noting the color each time.
- No yellow marble is drawn.
- The two marbles drawn have the same color.
- At least one marble of each color is drawn.
Answer (click to Show/Hide)
- :
- :
- This event has no outcomes as it is not possible to draw all three colors when selecting only two marbles. We would say the probability is 0.
- Your sock drawer is a mess. Twelve black socks and six red socks are mixed together. What are the chances that, without looking, you pick out a red sock?
Answer (click to Show/Hide)
This is a basic probability problem involving equally likely outcomes. The chance of picking a red sock is the ratio of the number of red socks to the total number of socks in the drawer.
The probability of an event is given by the formula:
Step 1: Find the total number of possible outcomes.
This is the total number of socks in the drawer.
There are 18 possible outcomes, one for each sock.Step 2: Find the number of favorable outcomes.
A favorable outcome is picking a red sock.
There are 6 red socks.Step 3: Calculate the probability.
Now we divide the number of favorable outcomes by the total number of outcomes.
Answer: The probability of picking out a red sock is 1/3, or approximately 33.3%.
- A ball is drawn randomly from a jar that contains 6 red balls, 2 white balls, and 5 yellow balls. Find the probability of the given event.
- A red ball is drawn
- A white ball is drawn
Answer (click to Show/Hide)
This problem involves finding the probability of an event where all outcomes are equally likely. We will first find the total number of balls in the jar.
The probability of an event is given by the formula:
First, find the total number of possible outcomes.
This is the total number of balls in the jar.
There are 13 possible outcomes.a. A red ball is drawn
Step 1: Find the number of favorable outcomes.
A favorable outcome is drawing a red ball. There are 6 red balls.
Step 2: Calculate the probability.
Answer (a): The probability of drawing a red ball is 6/13.
b. A white ball is drawn
Step 1: Find the number of favorable outcomes.
A favorable outcome is drawing a white ball. There are 2 white balls.
Step 2: Calculate the probability.
Answer (b): The probability of drawing a white ball is 2/13.
- Suppose you write each letter of the alphabet on a different slip of paper and put the slips into a hat. What is the probability of drawing one slip of paper from the hat at random and getting (assume y is a consonant for this exercise):
- A consonant
- A vowel
Answer (click to Show/Hide)
This problem involves finding the probability of an event where all outcomes are equally likely. We first need to determine the total number of letters and the number of consonants and vowels.
The probability of an event is given by the formula:
First, find the total number of possible outcomes.
There are 26 letters in the English alphabet.
a. A consonant
Step 1: Find the number of favorable outcomes.
The vowels are A, E, I, O, U. There are 5 vowels. Since 'y' is considered a consonant for this exercise, the number of consonants is the total number of letters minus the number of vowels.
There are 21 consonants.Step 2: Calculate the probability.
Answer (a): The probability of drawing a consonant is 21/26.
b. A vowel
Step 1: Find the number of favorable outcomes.
A favorable outcome is drawing a vowel. There are 5 vowels (A, E, I, O, U).
Step 2: Calculate the probability.
Answer (b): The probability of drawing a vowel is 5/26.
- A group of people were asked if they had run a red light in the last year. 150 responded "yes", and 185 responded "no". Find the probability that if a person is chosen at random, they have run a red light in the last year.
Answer (click to Show/Hide)
This problem involves finding the empirical probability of an event based on survey data. We first need to determine the total number of people surveyed.
The probability of an event is given by the formula:
Step 1: Find the total number of possible outcomes.
This is the total number of people who responded to the survey.
There are 335 total people in the group.Step 2: Find the number of favorable outcomes.
A favorable outcome is a person who responded "yes".
Step 3: Calculate the probability.
Now we divide the number of favorable outcomes by the total number of outcomes.
The fraction can be simplified by dividing both the numerator and denominator by their greatest common divisor, which is 5.
Answer: The probability that a person chosen at random has run a red light in the last year is 30/67, or approximately 44.8%.
- In a survey, 205 people indicated they prefer cats, 160 indicated they prefer dogs, and 40 indicated they don’t enjoy either pet. Find the probability that if a person is chosen at random, they prefer cats.
Answer (click to Show/Hide)
This problem involves finding the empirical probability of an event based on survey data. We first need to determine the total number of people surveyed.The probability of an event is given by the formula:
Step 1: Find the total number of possible outcomes.
This is the total number of people who responded to the survey.
There are 405 total people in the group.Step 2: Find the number of favorable outcomes.
A favorable outcome is a person who prefers cats.
Step 3: Calculate the probability.
Now we divide the number of favorable outcomes by the total number of outcomes.
The fraction can be simplified by dividing both the numerator and denominator by their greatest common divisor, which is 5.
Answer: The probability that a person chosen at random prefers cats is 41/81, or approximately 50.6%.
- Compute the probability of tossing a six-sided die (with sides numbered 1 through 6) and getting a 5.
Answer (click to Show/Hide)
This is a basic probability problem involving equally likely outcomes. The possible outcomes when rolling a fair six-sided die are {1, 2, 3, 4, 5, 6}.
The probability of an event is given by the formula:
Step 1: Find the total number of possible outcomes.
A six-sided die has 6 faces, so there are 6 possible outcomes.
Step 2: Find the number of favorable outcomes.
A favorable outcome is rolling a 5. There is only one face on the die with a 5.
Step 3: Calculate the probability.
Now we divide the number of favorable outcomes by the total number of outcomes.
Answer: The probability of getting a 5 is 1/6.
- Compute the probability of tossing a standard six-sided die and getting a 7.
Answer (click to Show/Hide)
This is a basic probability problem involving equally likely outcomes. The possible outcomes when rolling a fair six-sided die are {1, 2, 3, 4, 5, 6}.
The probability of an event is given by the formula:
Step 1: Find the total number of possible outcomes.
A six-sided die has 6 faces, so there are 6 possible outcomes.
Step 2: Find the number of favorable outcomes.
A favorable outcome is rolling a 7. Since the sides of a standard die are numbered 1 through 6, it is impossible to roll a 7.
Step 3: Calculate the probability.
Now we divide the number of favorable outcomes by the total number of outcomes.
Answer: The probability of getting a 7 is 0. This is an impossible event.
- Compute the probability of tossing a six-sided die and getting an even number.
Answer (click to Show/Hide)
This is a basic probability problem involving equally likely outcomes. The possible outcomes when rolling a fair six-sided die are {1, 2, 3, 4, 5, 6}.
The probability of an event is given by the formula:
Step 1: Find the total number of possible outcomes.
A six-sided die has 6 faces, so there are 6 possible outcomes.
Step 2: Find the number of favorable outcomes.
A favorable outcome is rolling an even number. The even numbers on a die are {2, 4, 6}.
Step 3: Calculate the probability.
Now we divide the number of favorable outcomes by the total number of outcomes.
Answer: The probability of getting an even number is 1/2.
- Compute the probability of tossing a six-sided die and getting a number less than 3.
Answer (click to Show/Hide)
This is a basic probability problem involving equally likely outcomes. The possible outcomes when rolling a fair six-sided die are {1, 2, 3, 4, 5, 6}.
The probability of an event is given by the formula:
Step 1: Find the total number of possible outcomes.
A six-sided die has 6 faces, so there are 6 possible outcomes.Step 2: Find the number of favorable outcomes.
A favorable outcome is rolling a number less than 3. The numbers on a die that are less than 3 are {1, 2}, so there are 2 favorable outcomes.Step 3: Calculate the probability.
Now we divide the number of favorable outcomes by the total number of outcomes.
Answer: The probability of getting a number less than 3 is 1/3.
- If you pick one card at random from a standard deck of cards, what is the probability it will be a King?
Answer (click to Show/Hide)
This is a basic probability problem involving equally likely outcomes. A standard deck has 52 cards.
The probability of an event is given by the formula:
Step 1: Find the total number of possible outcomes.
A standard deck of cards has 52 cards, there there are 52 total outcomes.Step 2: Find the number of favorable outcomes.
A favorable outcome is drawing a King. There are 4 Kings in a standard deck (King of Hearts, King of Diamonds, King of Clubs, King of Spades), so we have 4 total favorable outcomes.Step 3: Calculate the probability.
Now we divide the number of favorable outcomes by the total number of outcomes.
Answer: The probability of drawing a King is 1/13.
- If you pick one card at random from a standard deck of cards, what is the probability it will be a Diamond?
Answer (click to Show/Hide)
This is a basic probability problem involving equally likely outcomes. A standard deck has 52 cards.
The probability of an event is given by the formula:
Step 1: Find the total number of possible outcomes.
A standard deck of cards has 52 cards, there there are 52 total outcomes.Step 2: Find the number of favorable outcomes.
A favorable outcome is drawing a Diamond. There are 13 cards in the Diamond suit (Ace, 2, 3, 4, 5, 6, 7, 8, 9, 10, Jack, Queen, King), so we have a total of 13 favorable outcomes.Step 3: Calculate the probability.
Now we divide the number of favorable outcomes by the total number of outcomes.
Answer: The probability of drawing a Diamond is 1/4.
- A group consists of nine men and ten women. Find the probability that if four people are selected at random that all four are women.
Answer (click to Show/Hide)
To find the probability, we need to determine the total number of possible outcomes and the number of favorable outcomes. Since the order in which the people are selected does not matter, we will use combinations.
The probability of an event is given by the formula:
Step 1: Find the total number of possible outcomes.
This is the total number of ways to choose 4 people from the group of 19 (9 men + 10 women).
There are 3,876 possible ways to choose 4 people.Step 2: Find the number of favorable outcomes.
This is the number of ways to choose 4 women from the 10 available women.
There are 210 ways to choose 4 women.Step 3: Calculate the probability.
Answer: The probability of selecting four women is 35/646, or about 5.42%.
- You own 16 CDs. You want to randomly arrange 5 of them in a CD rack. What is the probability that the rack ends up in alphabetical order?
Answer (click to Show/Hide)
To find the probability, we first need to determine the total number of ways to arrange the CDs. Since the order of the CDs in the rack matters, this is a permutation problem. Then we identify the number of successful outcomes.
The probability of an event is given by the formula:
Step 1: Find the total number of possible outcomes.
This is the total number of ways to arrange 5 CDs from a collection of 16. We use the permutation formula P(n, r), where n=16 and r=5.
There are 524,160 different ways to arrange 5 CDs from the 16 available.Step 2: Find the number of favorable outcomes.
There is only one way for the CDs to be in alphabetical order. So, the number of favorable outcomes is 1.Step 3: Calculate the probability.
Answer: The probability that the rack ends up in alphabetical order is 1 in 524,160.
- A jury pool consists of 27 people, 14 men and 13 women. Compute the probability that a randomly selected jury of 12 people is all male.
Answer (click to Show/Hide)
To find the probability, we will calculate the total number of possible juries and the number of juries that consist only of men. Since the order in which jurors are selected does not matter, we will use combinations.
The probability of an event is given by the formula:
Step 1: Find the total number of possible outcomes.
This is the total number of ways to choose a jury of 12 from the 27 people available.
There are 17,363,355 possible juries.Step 2: Find the number of favorable outcomes.
This is the number of ways to choose 12 men from the 14 available men.
There are 91 ways to choose a jury of all men.Step 3: Calculate the probability.
Answer: The probability of selecting a jury of all men is 91 in 17,383,860, which is extremely low.
- In a lottery game, a player picks six numbers from 1 to 48. If 5 of the 6 numbers match those drawn, the player wins second prize. What is the probability of winning this prize?
Answer (click to Show/Hide)
To solve this, we need to find the total number of possible lottery combinations and then find the number of combinations that result in a second-prize win. Since the order of the numbers does not matter, we use combinations.
The probability of an event is given by the formula:
Step 1: Find the total number of possible outcomes.
This is the total number of ways the lottery can draw 6 numbers from 48.
There are 12,271,512 possible combinations of winning numbers.Step 2: Find the number of favorable outcomes.
To win second prize, the player must have chosen exactly 5 of the 6 winning numbers and 1 non-winning number.First, we find the number of ways to choose 5 of the 6 winning numbers: C(6, 5) = 6.
Second, we find the number of ways to choose 1 of the 42 non-winning numbers (48 total - 6 winning): C(42, 1) = 42.
To find the total number of favorable outcomes, we multiply these two results together.
There are 252 ways to choose a second-prize winning ticket.Step 3: Calculate the probability.
Answer: The probability of winning second prize is 252 in 12,271,512, which is approximately 0.002%.
- In a lottery game, a player picks six numbers from 1 to 48. If 4 of the 6 numbers match those drawn, the player wins third prize. What is the probability of winning this prize when purchasing a single lottery ticket?
Answer (click to Show/Hide)
To find the probability, we must determine the total number of possible lottery combinations and the number of combinations that result in a third-prize win. Since the order of the numbers does not matter, we will use combinations.
The probability of an event is given by the formula:
Step 1: Find the total number of possible outcomes.
This is the total number of ways the lottery can draw 6 numbers from 48. This remains the same as the previous problem.
There are 12,271,512 possible combinations of winning numbers.Step 2: Find the number of favorable outcomes.
To win third prize, the player must have chosen exactly 4 of the 6 winning numbers and 2 of the non-winning numbers.First, we find the number of ways to choose 4 of the 6 winning numbers: C(6, 4) = 15.
Second, we find the number of ways to choose 2 of the 42 non-winning numbers: C(42, 2) = 861.
To find the total number of favorable outcomes, we multiply these two results together.
There are 12,915 ways to choose a third-prize winning ticket.Step 3: Calculate the probability.
Answer: The probability of winning second prize is 252 in 12,271,512, which is approximately 0.002%.
- Compute the probability that a 5-card poker hand is dealt to you that contains all hearts.
Answer (click to Show/Hide)
This is a probability problem that can be solved using combinations, since the order in which the cards are dealt does not matter. A standard deck has 52 cards, and there are 13 hearts.
The probability of an event is given by the formula:
Step 1: Find the total number of possible outcomes.
This is the total number of different 5-card hands that can be dealt from a standard 52-card deck.
There are 2,598,960 possible 5-card hands.Step 2: Find the number of favorable outcomes.
A favorable outcome is a 5-card hand where all cards are hearts. There are 13 hearts in the deck, so we need to find the number of ways to choose 5 of them.
There are 1,287 different 5-card hands that contain only hearts.Step 3: Calculate the probability.
Answer: The probability of being dealt a 5-card hand containing all hearts is 1,287 in 2,598,960, which is approximately 0.0495%.
- Compute the probability that a 5-card poker hand is dealt to you that contains four Aces.
Answer (click to Show/Hide)
This problem is solved using combinations, as the order of the cards in a hand does not matter. We need to find the total number of possible 5-card hands and then determine how many of those hands contain four Aces.
The probability of an event is given by the formula:
Step 1: Find the total number of possible outcomes.
This is the total number of different 5-card hands that can be dealt from a standard 52-card deck.
There are 2,598,960 possible 5-card hands.Step 2: Find the number of favorable outcomes.
A favorable outcome is a hand with four Aces and one other card.First, we find the number of ways to choose all 4 Aces from the 4 Aces in the deck: C(4, 4) = 1.
Second, we find the number of ways to choose the fifth card from the remaining 48 non-Ace cards: C(48, 1) = 48.
To find the total number of favorable outcomes, we multiply these two results.
There are 48 different hands that contain four Aces.Step 3: Calculate the probability.
Answer: The probability of being dealt a 5-card hand containing four Aces is 48 in 2,598,960, which is approximately 0.0018%.
- What is the probability of being dealt 6 cards that are all red from a 52 card deck?
Answer (click to Show/Hide)
This problem is solved using combinations, since the order of the cards in a hand does not matter. A standard deck has 52 cards, with 26 red cards (Hearts and Diamonds) and 26 black cards. We need to find the probability of drawing a 6-card hand where all cards are red.
The probability of an event is given by the formula:
Step 1: Find the total number of possible outcomes.
This is the total number of different 6-card hands that can be dealt from a standard 52-card deck.
There are 20,358,520 possible 6-card hands.Step 2: Find the number of favorable outcomes.
A favorable outcome is a 6-card hand where all cards are red. There are 26 red cards in the deck, so we need to find the number of ways to choose 6 of them.
There are 230,230 different 6-card hands that contain only red cards.Step 3: Calculate the probability.
Answer: The probability of being dealt a 6-card hand containing all red cards is 230,230 in 20,358,520, which is approximately 1.13%.
- The following two-way contingency table gives the breakdown of the population in a particular locale according to age and tobacco usage:
Age Tobacco Use Smoker Non-smoker Under 30 0.05 0.20 Over 30 0.20 0.55 A person is selected at random. Find the probability of the following events.
- The person is a smoker.
- The person is under 30.
- The person is a smoker who is under 30.
Answer (click to Show/Hide)
- The following two-way contingency table gives the breakdown of the population in a particular locale according to party affiliation (A, B, C, or None) and opinion on a bond issue:
Affiliation Opinion Favors Opposes Undecided A 0.12 0.09 0.07 B 0.16 0.12 0.14 C 0.04 0.03 0.06 None 0.08 0.06 0.03 A person is selected at random. Find the probability of each of the following events.
- The person is affiliated with party B.
- The person is affiliated with some party.
- The person is in favor of the bond issue.
- The person has no party affiliation and is undecided about the bond issue.
Answer (click to Show/Hide)
- .
Attributions
- This page contains modified content from David Lippman, "Math In Society, 2nd Edition." Licensed under CC BY-SA 4.0.
- This page contains modified content from "College Algebra 2017." Lumen Learning. Licensed under CC BY 4.0.
- This page contains modified content from Introductory Statistics Copyright © 2024 by LOUIS: The Louisiana Library Network is licensed under a Creative Commons Attribution-ShareAlike 4.0 International License, except where otherwise noted.
- This page contains content by Robert Foth, Math Faculty, Pima Community College, 2021. Licensed under CC BY 4.0.
- Portions of the exercise solutions in this answer key were generated with the assistance of Gemini, a large language model from Google.
