5.2 Modeling Exponential Relationships with Algebra

5.2: Modeling Exponential Relationships with Algebra
Learning Objectives
Upon completion of this section, you should be able to
- Identify elements in an exponential model (equation) of the form
- Evaluate an exponential model
- Create an exponential model with algebra between two quantitative variables
- Graph an exponential model
- Solve application problems using an exponential model created with algebra
Exponential Models
When populations grow rapidly, we often say that the growth is “exponential”. To a mathematician, however, the term exponential growth has a very specific meaning. In this section, we will take a look at exponential models, which model this kind of rapid growth and also decay.
When exploring linear growth, we observed a constant rate of change—a constant number by which the output increased by addition for each unit increase in input. For example, in the equation , the slope tells us the output increases by 3 each time the input increases by 1. Now, we'll investigate exponential models, which describe percentage-based growth or decay where the value of an output is increased by multiplication.
Exponential Model
An exponential model (equation) has a form , where is any nonzero number, is a positive real number not equal to 1.
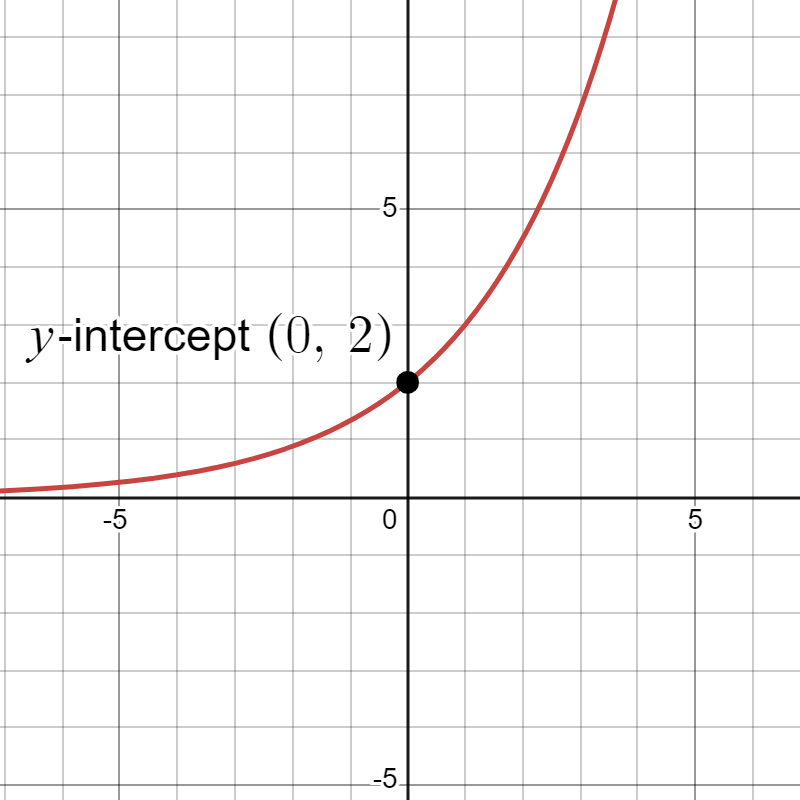
- If , we say it models exponential growth. As increases, the outputs of the model will increase as well and continue to increase at a much faster rate without bound.
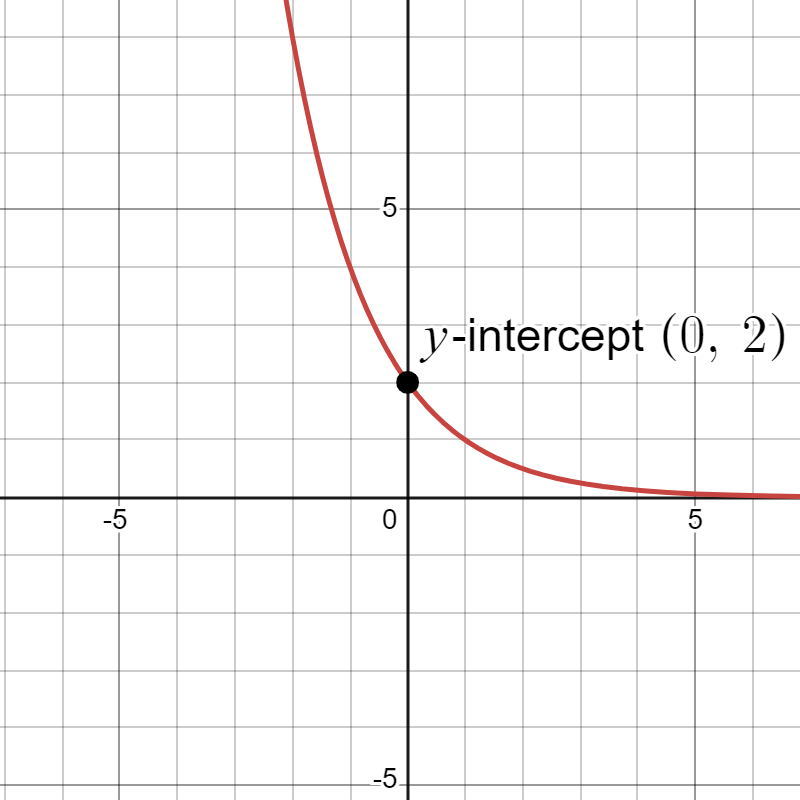
- If , the model shows exponential decay. As increases, the outputs for the model decrease and continue to decrease, but levels off to the -axis (gets close to zero, but will not equal to zero).
- When the output is , so we often call a the initial amount in applications (or the starting amount). We also say is the -intercept on the graph for the model.
- The value is what we call the growth multiplier. If we increase by 1, then is what we multiply the previous output value by to get the new output.
|
|
|
For us to gain a better understanding of exponential growth, let us contrast exponential growth with linear growth. We will construct two models. The first model is exponential. We will start with an input of 0, and increase each input by 1. The second model is linear. For both models they will start with the same outputs on the first two steps. See the table below
| x | ||
|---|---|---|
| 0 | 1 | 0 |
| 1 | 2 | 2 |
| 2 | 4 | 4 |
| 3 | 8 | 6 |
| 4 | 16 | 8 |
| 5 | 32 | 10 |
| 6 | 64 | 12 |
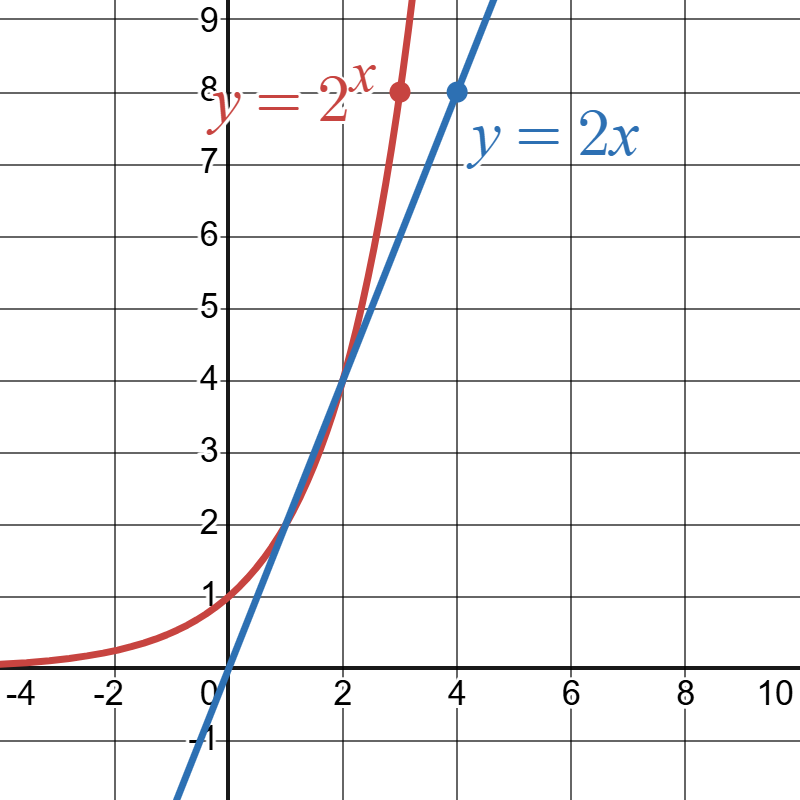
Looking just down the middle column we see that for exponential growth we are multiplying by the same value of 2 to go from one output to the next (this is what is meant by saying was the growth multiplier). Instead of adding a fixed constant the exponential multiplies by a fixed constant. From the table we also see how quickly the growth on the exponential model takes over the growth from the linear model. In general one thing we can say about the difference between exponential growth and linear growth is that at some point when comparing these two models the exponential growth model will eventually outpace the linear model and exceed the values. Below is a comparison of the two graphs:
Click to reveal more information
The image depicts a graph with two functions plotted on a Cartesian coordinate plane. The horizontal axis ranges from -4 to 10, while the vertical axis ranges from -1 to 9. The first function, ( y = 2x ), is a blue straight line passing through the origin with points marked at (2, 4) and (3, 6). The second function, ( y = 2^x ), is a red exponential curve, starting near the origin and rising steeply after crossing 2 on the x-axis. Both functions intersect at point (2, 4). The graph's background features a grid of equally spaced lines.
Example 1
Which of the following equations are examples of exponential models? If it is an exponential model identify the starting amount (-intercept value) and the growth multiplier.
Solution
- Not Exponential. This is a linear model.
- Not Exponential. The base for is a variable and not a constant.
- Exponential model. Starting amount is 5 and growth multiplier is 4.
- Exponential model. Starting amount is 3 and growth multiplier is
Try it Now 1
Which of the following equations are examples of exponential models? If it is an exponential model identify the starting amount (-intercept value) and the growth multiplier.
Answer (click to Show/Hide)
- This is not an exponential model as the base is a variable and not a constant.
- This is an exponential model. The starting amount is 200 and the growth multiplier is 5.
- This is an exponential model. The starting amount is 1 and the growth multiplier is .
- Recall the base for an exponential model is always positive constant, and . Thus, does not represent an exponential model because the base, , is less than 0.
- This is a linear model and not an exponential model.
Evaluate an exponential model
To evaluate an exponential model with the form , we substitute with the given value and calculate the resulting power. For example:
Let . What is the value of the output for the model when ?
To evaluate an exponential model with a form it is important to follow the order of operations. For example:
Let . What is the value of the output for the model when ?
Example 2
Evaluate the exponential model at and .
Solution
Evaluate at . Make sure to follow the order of operations:
Evaluate at .
Try it Now 2
The population of India was about 1.39 billion in the year 2021, with an annual growth rate of about . This situation is represented by the exponential growth model , where is the number of years since 2021. To the nearest thousandth, what will the population of India be in 2030?
Hint 1 (click to Show/Hide)
First find the value of to use for the year 2030. Remember that was defined as the number of years since 2021.
Answer (click to Show/Hide)
To estimate the population in 2030, we evaluate the models for , because . Rounding to the nearest thousandth,
There will be about 1.5202 billion people in India in the year 2030.
One thing to note in the above work is how we carried out many more decimal places than required while still doing further calculations. The reason for doing so was to avoid rounding error in an answer that would get compounded by further calculations.
Create an exponential model with algebra between two quantitative variables
Before we explore applications and the graph of an exponential model let us first look at strategies for finding the exponential equation from two points. We will only consider applications where both points have positive -values (both are above the -axis when plotted). Below are a few algebra facts we will need to know for the process.
Properties of Exponents
These properties of exponents are leveraged in this section, especially the quotient rule, which you will use immediately below to solve for the base of an exponential model when given two points.
| Property | Definition | Example |
|---|---|---|
| Property of 1 | ||
| Property of 0 | ||
| Product Property | ||
| Property of Negatives | ||
| Quotient Property | ||
| Power of a Power Property |
There are many more exponent properties in algebra, but only the above is needed for our work with exponential growth.
The other facts from algebra we will need are given below about solving equations where the unknown variable is in the base and it is raised to an integer power along with a general strategy for solving for an exponential model.
Solving equation of the form
Let be a positive number, be a nonzero integer, and . To solve an equation of the form you raise both sides of the equation to the power.
General Strategy to find an Exponential Model given two points
To find an exponential model of the form
given two points we can break it down to two cases.
- Case 1: If one of the points is a -intercept, i.e. , then the initial amount is already given to you. Using , substitute the other point into the exponential model and solve for .
- Case 2: If neither points given has the form you can solve for and by doing the following:
- Step 1: Set up two equations by evaluating the model at both points.
- Step 2: Divide the second equation by the first (this will cancel out the unknown term).
- Step 3: Solve for .
- Step 4: Substitute back into either original equation to find .
The above assumes both (this means both points are above the horizontal axis or below the horizontal axis).
Let us look now at a few examples of creating an exponential model. In the next example below we will be given two values where one is the -intercept.
Example 3 (given a -intercept)
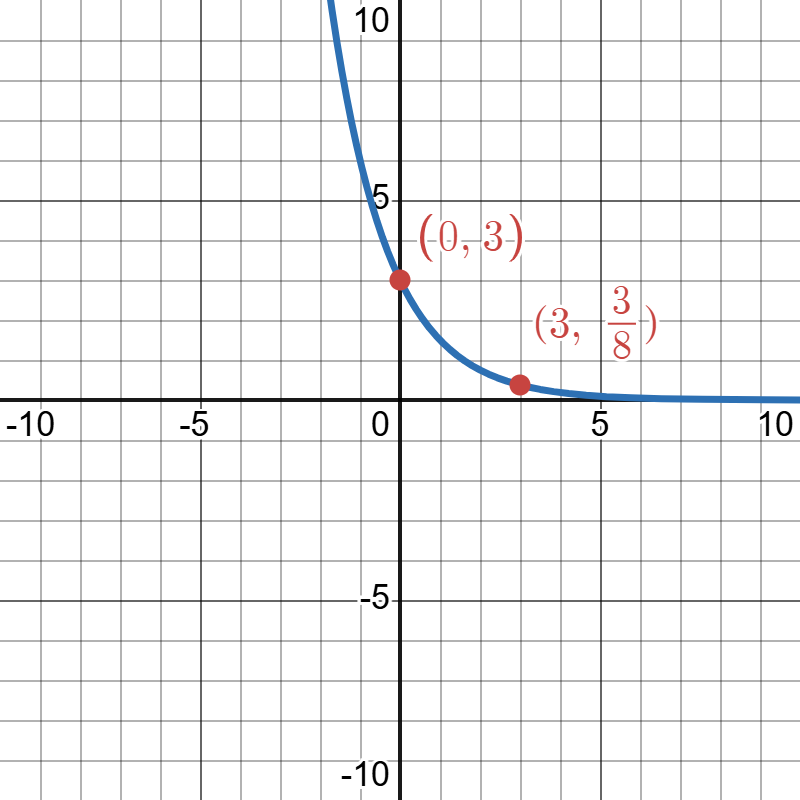
Given two points and find an exponential model through the points.
Solution
Start with the exponential model and use the point that gives the initial amount, . At this point we can say , but below shows why that is true showing what happens when we put the values in the point into the model.
We now solve for in the model using the other point .
The exponential model is
Click to reveal more information
The image is a graph displaying a curve on a Cartesian coordinate system with a grid in the background. The x-axis ranges from -10 to 10, and the y-axis ranges from -10 to 10, with increments of 1. A blue curve represents a decreasing function, starting vertically around y=10 close to the y-axis and gently curving to the right as it approaches the x-axis. Two points on the curve are marked with red dots. The first point is labeled with the coordinates (0, 3), located where the curve crosses the y-axis. The second point is labeled (3, 3/8), located on the curve to the right of the y-axis. Both coordinate labels are written in red.
Evaluating roots on the calculator
In the previous example, we had to calculate the 3rd root of a number. This is different than taking the basic square root, v. Many scientific calculators have a button for general roots. It is typically labeled like:
To evaluate the 3rd root of 8, for example, we’d either type 3 8, or 8 3, depending on the calculator. Try it on yours to see which to use – you should get an answer of 2.
If your calculator does not have a general root button, all is not lost. You can instead use the property of exponents which states that . So, to compute the 3rd root of 8, you could use your calculator’s exponent key to evaluate . To do this, type:
The parentheses tell the calculator to divide 1/3 before doing the exponent.
In the next example we will find the exponential model for two general points where neither is the -intercept.
Example 4
Given two points find the exponential model that goes through them. Round the values of and to four decimal places.
Solution
Because we don’t have the initial value, we substitute both points into an equation of the form , and then solve the system for and .
- Substituting gives:
- Substituting gives
Next divide the second equation by the first (this step can also be swapped so you divide the first by the second - choose whichever appears to be easier to deal with):
Now cancel out on the right hand.
Rewrite the right hand side using the quotient property of exponents:
Next raise both sides of the equation to the power to remove the exponent on term using the power of a power property of exponents:
At this point we can approximate to four decimals:
Next use the value of in the second equation (as it appears less complicated to deal with) to solve for the value of :
The equation for the exponential model is:
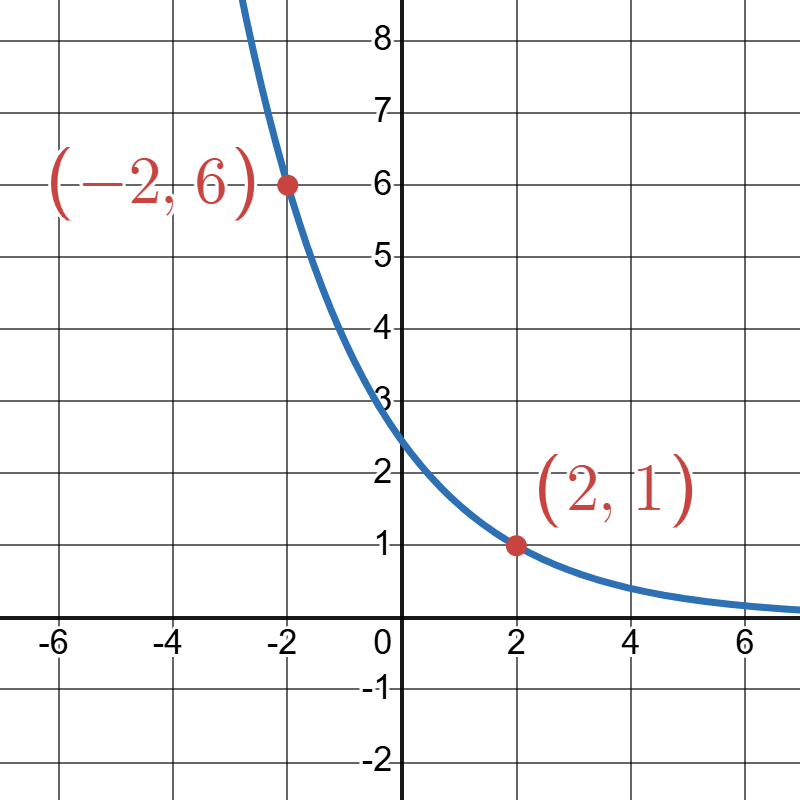
Click to reveal more information
The image features a section of a Cartesian coordinate graph with a blue curve passing through two points marked in red. The horizontal and vertical grid lines are visible, with the x-axis and y-axis labeled numerically. The first point is located at (-2, 6) on the curve, labeled in red text. The second point is at (2, 1), also labeled in red. Both points are marked with red circles on the curve. The curve slopes downward from left to right, illustrating a negative correlation.
Try it Now 3
Find an exponential equation that goes through the points . Round the values of and to four decimal places.
Hint 1 (click to Show/Hide)
Were either of the two points given a -intercept?
Hint 2 (click to Show/Hide)
Neither point was a -intercept. So the first step is to create two equations from the given information. Each point given will create an equation. After finding those two equations you will solve that system of equations by solving for in either equation and then substituting it into the other equation.
Answer (click to Show/Hide)
Because we don’t have the initial value, we substitute both points into an equation of the form , and then solve the system for and .
- Substituting gives:
- Substituting gives
Next divide the second equation by the first:
Now cancel out on the right hand.
Rewrite the right hand side using the quotient property of exponents:
Next raise both sides of the equation to the power to remove the exponent on term using the power of a power property of exponents:
At this point we can approximate to four decimals:
Next use the value of in the first equation to solve for the value of :
The equation for the exponential model is:
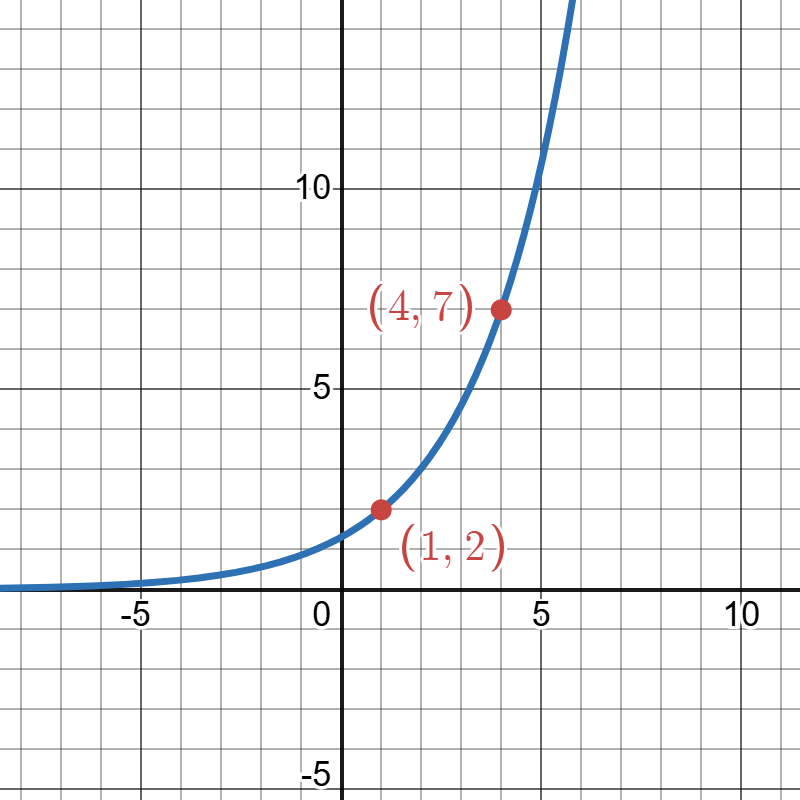
Click to reveal more information
The image depicts a section of a Cartesian graph with a blue curve plotted against a grid. The graph consists of a vertical y-axis and a horizontal x-axis, both marked with increments of 5. The curve appears to be an exponential model, steadily increasing as it moves to the right. Two points are highlighted on the curve with red dots: one at the coordinates (1, 2) and another at (4, 7). The coordinates of these points are labeled in red text next to each point.
Graph an exponential model
When graphing linear models we said only two points are needed. The same can be said about an exponential model of the form , but the preference for the points to use would be the -intercept at and the point where the input is 1, . The reason for the choice of the second point is that for each one unit increase in we will multiply the coordinate by . Going the other direction for each one unit decrease in we will divide the coordinate by .
Let us examine the graph of by plotting the ordered pairs given in the table below and connecting the points with a smooth curve.
| -2 | 0.25 |
| -1 | 0.5 |
| 0 | 1 |
| 1 | 2 |
| 1 | 4 |
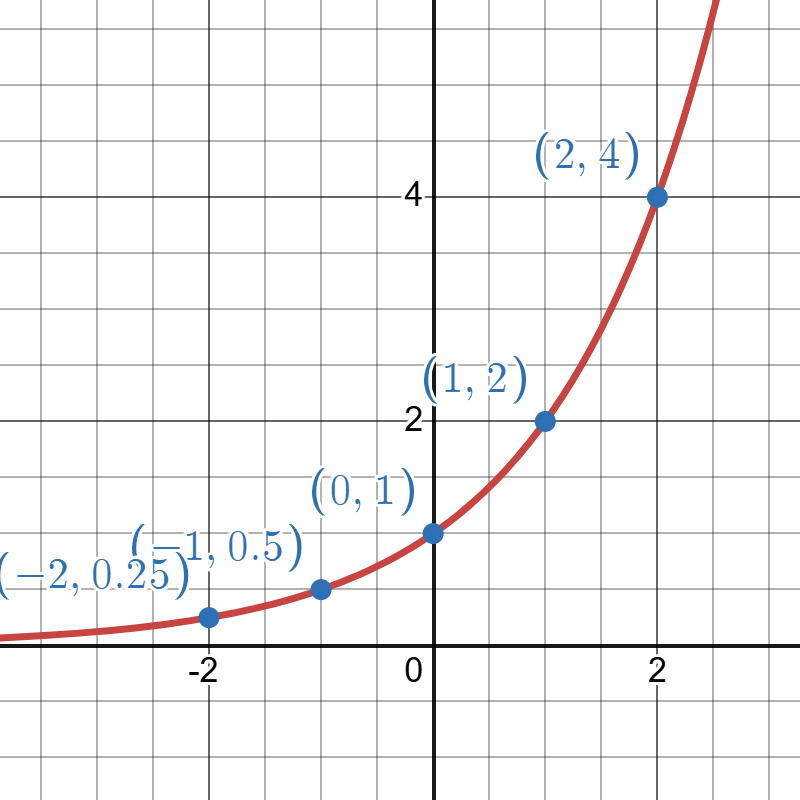
Click to reveal more information
The image depicts a graph of an exponential model. A red curve passes through several labeled blue points, indicating key coordinates on the grid. The horizontal axis is labeled from -3 to 3, and the vertical axis is marked from 0 to 4. The curve begins below the horizontal axis, curving steeply upwards as it moves right. The labeled coordinates along the curve are (-2, 0.25), (-1, 0.5), (0, 1), (1, 2), and (2, 4). The graph has a light gray grid background with both vertical and horizontal lines.
Some observations we can make is that if you look at the point we can move forward one unit in by multiplying by the base 2. Add 1 to the input and multiply the output by 2 to get the next point .
If we want to move to the left from we would subtract one from the input value and divide the output by the base 2. This gives us the point to the left as .
We also see that as increases that this exponential model will increase in the output values and starts to grow rapidly (the changes in output get larger with each step). As decreases (gets more negative) the graph is approaching the horizontal axis.
Graphing Exponential Models of the form
- Find the -intercept and the point where the input is 1,
- Use the base to find additional points by moving left and right from one of the known points
- Connect the points with a smooth curve
Example 5
Graph the exponential model defined by
Solution
Begin by choosing input values. As mentioned above it is enough to use the input values of 0 and 1. From there we can extend and add additional points by multiplying by the base 3 or dividing by the base 3.
To add an additional point at we multiply the output at by the base 3 to get another point at .
To add an additional point at we divide the output at by the base 3 to get another point at .
Next plot the coordinate pairs and draw the exponential curve through the points. The graph below is for the model
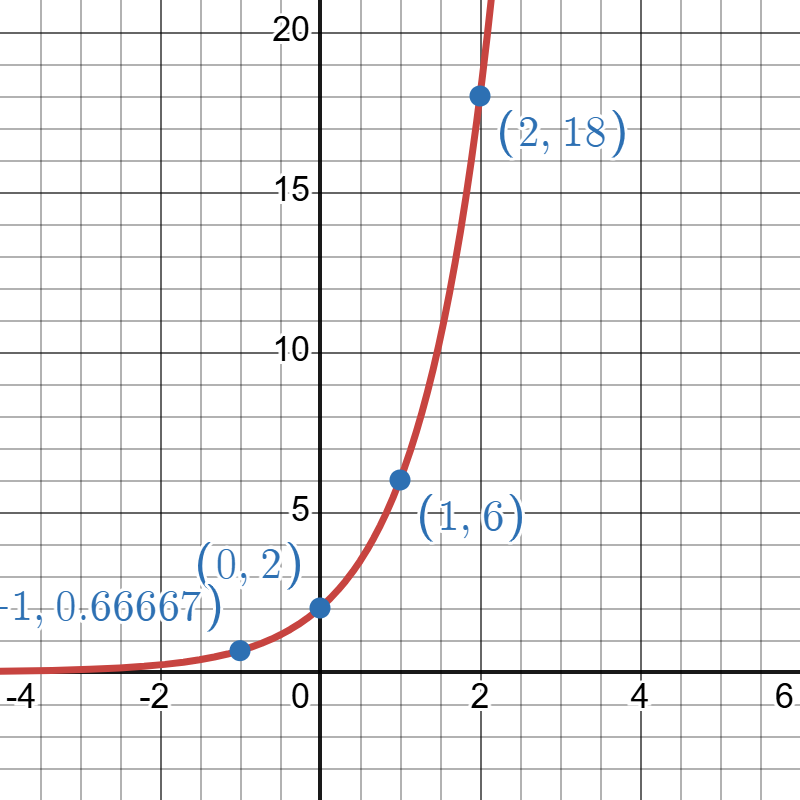
Click to reveal more information
The image is a graph depicting a exponential curve on a Cartesian plane. The grid background shows horizontal and vertical lines with numerical labels at intervals, marking the axes. A red curve begins near the bottom left, swooping upwards steeply as it moves to the right. Four blue points are plotted along the curve at specific coordinates: (-1, -0.66667), (0, 2), (1, 6), and (2, 18). These points are labeled in light blue text near each. The horizontal axis ranges from -4 to 6, while the vertical axis ranges from 0 to 20.
The above graph has a base greater than 1, so we are seeing exponential growth.
Try it Now 4
Graph the exponential model given by
Hint 1 (click to Show/Hide)
Start with evaluating the model at and to find two points. Further points can be found by using the base or through evaluation.
Answer (click to Show/Hide)
Evaluate at and :
Continue to add points by using the base to move forward and backward on the two points already found:
Find the coordinate at by multiplying the output at by the base :
To find the coordinate at you would divide the output at by the base :
Plot the coordinates found and connect to form the exponential curve.
Click to reveal more information
The image is a grid graph featuring a red curve representing a decreasing exponential model. The curve starts high near the y-axis and slopes downwards as it moves right. For each unit increase in we see the graph decreasing by a factor of . Several blue points are marked on the curve at coordinates (-1, 20), (0, 10), (1, 5), and (2, 2.5), each annotated in blue text. The x-axis and y-axis intersect at the origin (0, 0), and tick marks are labeled on both axes at intervals, with numbers indicated at -2, 0, 2, 4, and 6 on the x-axis, and 0, 5, 10, 15 and 20 on the y-axis.
Solve application problems using an exponential model
Many real-world phenomena exhibit growth that occurs not by a fixed amount in each time period, but rather by a fixed percentage increase. This type of growth, where a quantity increases by a consistent proportion over equal intervals, can be modeled using exponential equations.
Imagine a scenario where the value of an investment grows by 5% each year, or a bacterial colony doubles in size every hour. These situations, where the rate of increase depends on the current size or amount, are prime candidates for exponential modeling.
Find an exponential model in applications
- Identify the variables in the given information
- Assign the variables letter names
- If the initial amount is given in the information assign that value to in the model. Using the value of substitute the other information into the exponential model and solve .
- If the initial amount is not given you can use the approach for solving an exponential model when given two points where neither are the -intercept.
Example 6
The population in Tucson in 2019 was approximately 548.1 thousand people and 551.3 thousand people in 2020. If the population continues to grow by the same percent each year (grows exponentially), then what would be the population in the year 2030?
Solution
The information provided can be used to build an exponential model as we have two data points to work with. The first is an initial amount of the population in the year 2019 and the second is the population one year later. To build the model we will put it in the form , where represents the number of years since 2019 and is the population.
In the model we know represents the initial amount. This means as that is the population in the year 2019 (0 years since 2019).
To find we can put in the second piece of information into the model. The population in 2020 was 551.3 thousand, since 2020 is 1 year after 2019 we know when that
We can write the model as
Note: we rounded the value of to six decimal places to reduce the amount of rounding errors in the work we do afterwards with the model. It is best to use the exact value whenever possible, but it can lead to formulas looking more complex then need be.
To find the population in 2025 we evaluate the model at .
The population is estimated to be 567.6 thousand people in the year 2025 based on our exponential model.
Why did we choose in the example above for to be the number of years since 2019 and not just the year itself? Part of the reason for this was to cut down the work needed to create the model. By using 2019 as the initial year we were able to insert that population in for the value of .
If we had not done that we would have same value for as we had above, but . This would give us a model of the form . Looking at this model we lose some connection back to the application as the initial amount now represents the population in year 0. The version where we allow to be the number of years since 2019 allows us to connect the information in the model with the population for the year 2019 (it retains more information for the reader as it gives them the population in 2019 for the initial amount).
Example 7
The number of employees at Amazon has been growing at an exponential rate. Find a model for the number of employees since 2006 given that there were 88,400 employees in 2012 and 154,100 in 2014. Using this model how many employees would be at amazon in 2020?
Solution
Let be the number of employees at Amazon and be the number of years after 2006. The model would have the form .
Now we are asked to use 2006 to represent the starting year for the model, so we are not given any initial amount as the first amount known is for the year 2012 () and the number of employees as 88,400. The given information can be written as two ordered pairs: and .
Create two equations based on the given points
- Substituting gives
- Substituting gives
Start by dividing the second equation by the first equation:
Next simplify the right hand side using property of exponents:
Now solve for b:
Use the value of in the first equation to solve for the value of :
The equation for the exponential model is
Use the model to predict the number of employees in 2020. Use in the model:
The model predicts that in 2020 Amazon would have had approximately 816,332 employees.
Try it Now 5
Sales of Apple Ipod peaked in fiscal year 2008 with 54.83 million units sold. By 2012 the number of sales had decreased to 35.17 million units. Assuming the decrease from 2008 was exponential find a model for the number of units sold (in millions) years after 2008. Use this model to predict the number of units sold in 2014 (the year it was discontinued).
Hint 1 (click to Show/Hide)
Let N be the number of Ipods sold (in millions) and t be the number of years since 2008. The model would be .
Determine if you can enter the value for by seeing if you are given an initial amount.
Answer (click to Show/Hide)
Let N be the number of Ipods sold (in millions) and t be the number of years since 2008. The model would be .
We are given that in 2008 a total of 54.83 million units were sold. Since is the number of years after 2008 the 54.83 million units is the starting amount for when . We can enter 54.83 for in the model.
To find the value of in the model we will use the the information about 2012 with 35.17 million units sold. When we know .
The exponential model for Applie Ipod saled since 2008 is .
To find the predicted number of ipod sales in 2014 we evaluate the model at
The model predicted the sales would be 28.17 million units.
Exercises
- Identify which are exponential models. If it is an exponential model state if it is exponential growth or decay.
Answer (click to Show/Hide)
- Not an exponential model.
- Exponential model with base 9, so exponential growth since base is greater than 1.
- Not an exponential model. This is a linear model.
- Exponential model with base 0.0763, so exponential decay since base is less than 1.
- Exponential model with base , so exponential growth since base is greater than 1.
- Given an exponential model of the form how do we determine if shows exponential growth or decay.
Answer (click to Show/Hide)
In the model we look at the base and see if it is between 0 and 1 or greater than 1. If the base is between 0 and 1 we say it is exponential decay. If the base is greater than 1 we say it is exponential growth.
- Determine if the scenario can be modeled with an exponential equation.
- The tuition increases by $2 each year per credit hour.
- The tuition increases by 1% each year per credit hour.
- The value of a car depreciates by 15% annually over the last 10 years.
- For each delivery stop the driver increases the cost by $5.00 for the delivery.
- Population in a culture of bacterial double every four hours.
Answer (click to Show/Hide)
- Not exponential. Example of linear growth by adding a fixed constant.
- Exponential. Would be multiplying by a percent increase each year.
- Exponential. Would be multiplying by a percent decrease each year.
- Not exponential. Example of linear growth by adding a fixed constant.
- Exponential. Would be multiplying by the population by 2 for every four hours.
- Find the formula for an exponential equation that passes through the two points .
Answer (click to Show/Hide)
- Find the formula for an exponential equation that passes through the two points .
Answer (click to Show/Hide)
- Find the formula for an exponential equation that passes through the two points .
Answer (click to Show/Hide)
- Find the formula for an exponential equation that passes through the two points . Round values to six places.
Answer (click to Show/Hide)
- Find the formula for an exponential equation that passes through the two points .
Answer (click to Show/Hide)
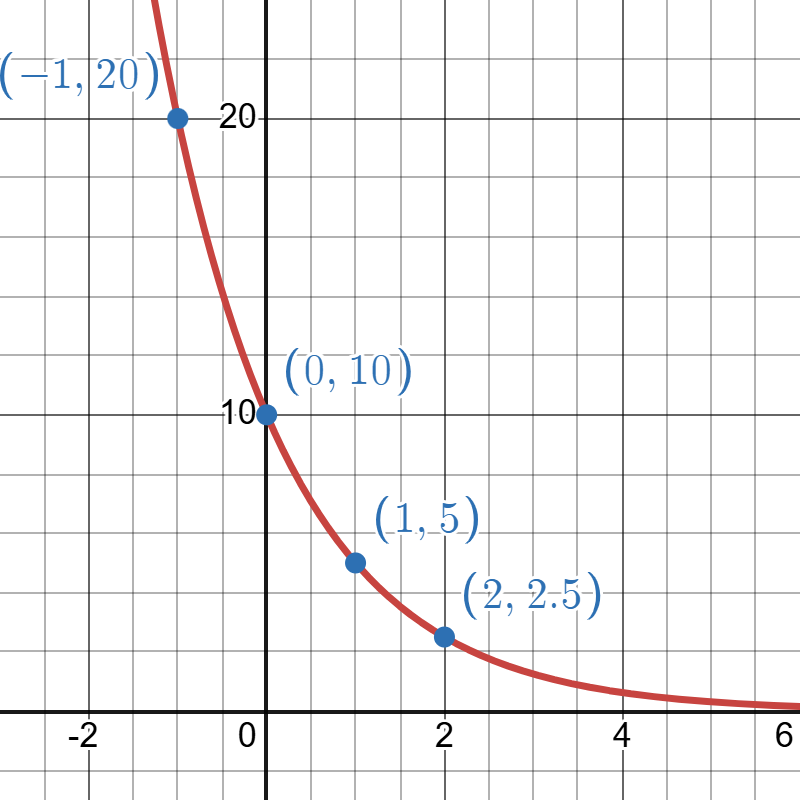
- Find an equation for an exponential model that goes through the points and graph this model showing the -intercept. Round all values to two decimal places.
Answer (click to Show/Hide)
Exponential Model:
Graph of produced on Desmos. Go to Desmos to explore this model. 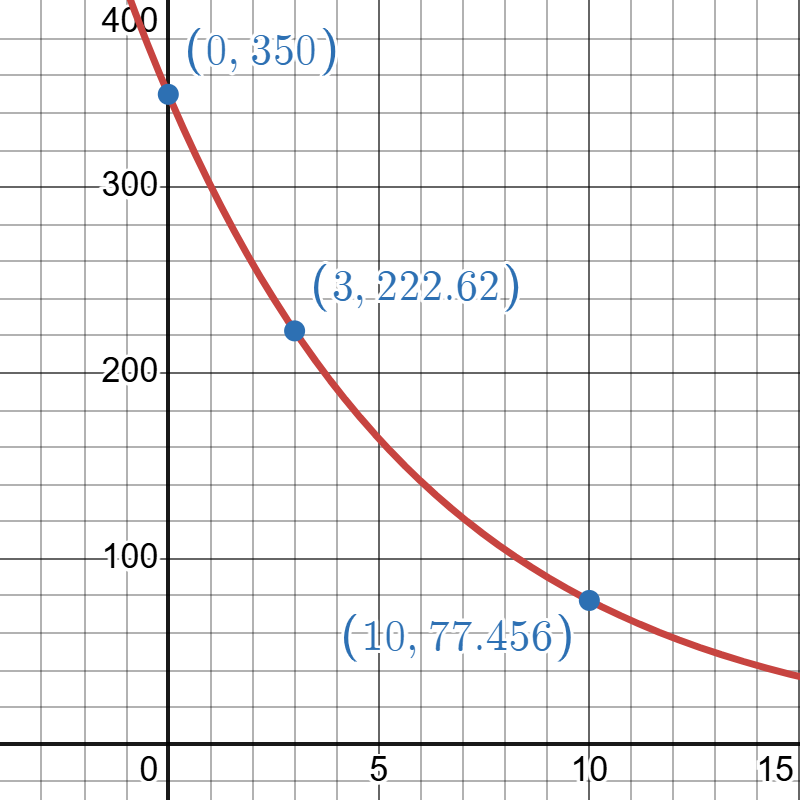
Click to reveal more information
The image is a graph on a grid with a red exponential curve sloping downward from left to right. The x-axis ranges from 0 to 15, and the y-axis ranges from 0 to 400. The curve passes through three blue points, which are labeled with their coordinates in blue text. The first point is at (0, 350), the second at (3, 222.62), and the third at (10, 77.456). The graph background consists of a series of blue grid lines.
- Find an equation for an exponential model that goes through the points and graph this model showing the -intercept. Round all values to six decimal places.
Answer (click to Show/Hide)
Exponential Model:
Graph of produced on Desmos. Go to Desmos to explore this model. 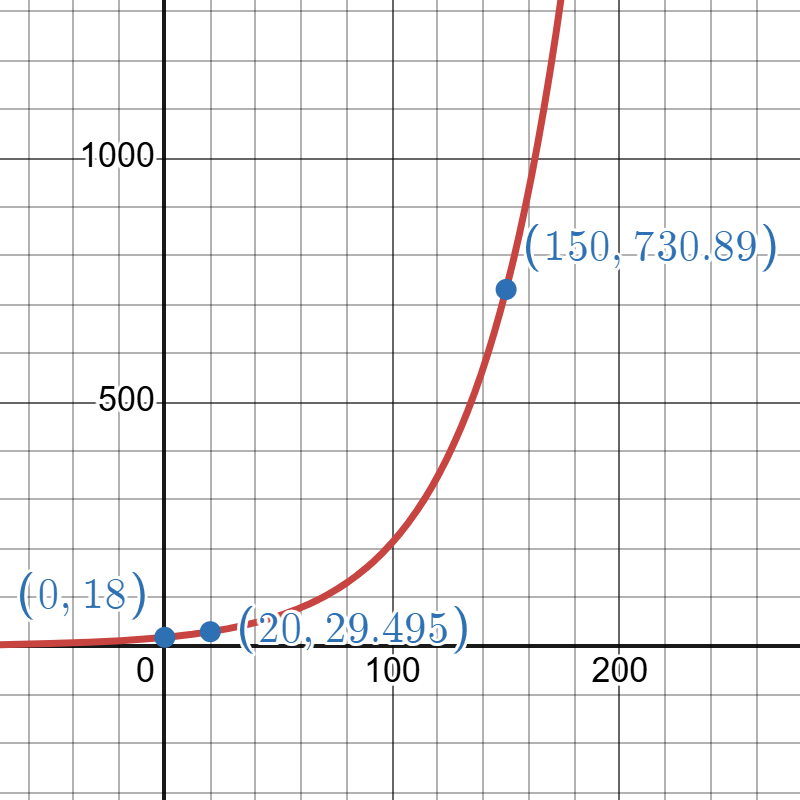
Click to reveal more information
The image is a graph with a red exponential curve plotted on a grid with x and y axes. The x-axis ranges from 0 to 250 with markings at intervals of 50, and the y-axis ranges from 0 to 1000 with markings at intervals of 500. The curve originates just above the x-axis and steadily increases in steepness as it rises to the right. Three blue points are marked on the curve, located at specific coordinates along the graph: one at (0, 18), another at (20, 29.495), and a third at (150, 730.89). Each point is labeled in blue text corresponding to its coordinates.
- The Mexican gray wolf was reintroduced to Arizona and New Mexico regions in 1998. Authorities initially released 11 wolves at that time. In 2012 there were 58 wolves. Assuming the growth was exponential find a model for the number of wolves after the year 1998. Use this model to predict the number of wolves in the population in 2020. Round the values in the model to six places and population in 2020 to nearest integer.
Answer (click to Show/Hide)
The population in 2020 is projected to be 150.
- In 1990, the residential energy use in the US was responsible for 962 million metric tons of carbon dioxide emissions. By the year 2000, that number had risen to 1182 million metric tons. If the emissions grow exponentially and continue at the same rate, what will the emissions grow to by 2050?
Answer (click to Show/Hide)
Let represent the number of years since 1990 and be the metric tons (in emissions) of carbon dioxide emissions.
The exponential model is .
Evaluate the model at to find that there is approximately 3308.4 million metric tons of carbon dioxide predicted by the model.
- The population in a city in 2020 is approximately 200 thousand and has been growing by 2.7% each year. If we assume the growth continues at the same rate estimate the population in 2030.
Answer (click to Show/Hide)
Exponential model is
Population in 2030 is estimate to be 261 thousand people.
- According to the New York Times the 7-day average for number of new cases of covid 19 on March 2nd was 9. One week later the 7-day average was 92. If we assume the growth rate of new cases follow an exponential model and continues to follow the same rate, then approximate the number of new cases five weeks from the start of the data collection on March 2nd.
Answer (click to Show/Hide)
Let be the number of days after March 2nd and be the 7-day average of new cases.
The exponential model would be
The 7 day average for new cases in five weeks (35 days) after March 2nd would be approximately 1,004,540.
On April 7th the reported 7 day average was 30,133. Source: New York Times
- A bacterial culture starts with 300 bacteria. After 4 hours the population has grown to 500 bacterial. If the population is growing exponentially find how many bacteria there are after 24 hours from the start time.
Answer (click to Show/Hide)
Let be the number of hours from start. The amount of bacterial present would be modeled by
The number of bacteria after 24 hours is projected to be 6,430.
- The population of a small town is modeled by , where is the number of years after 2010. What was the population in 2010? Is the population increasing or decreasing?
Answer (click to Show/Hide)
The population in 2010 is 45,000. The population is growing as the base is greater than 1.
- Suppose that you have a bowl of 500 Skittles, and each day you eat of the Skittles you have. Is the number of candies left changing linearly or exponentially? Write an equation to model the number of candies left after days.
Answer (click to Show/Hide)
The number of candies left would be changing exponentially. The model would be
Attributions
This page contains modified content from David Lippman, "Math In Society, 2nd Edition." Licensed under CC BY-SA 4.0.
This page contains modified content from "College Algebra," Abramson, Jay et al., OpenStax. Licensed under CC BY 4.0.
This page contains content by Robert Foth, Math Faculty, Pima Community College, 2021. Licensed under CC BY 4.0.
